Gaming company Inspired (NASDAQ: INSE) missed Wall Street’s revenue expectations in Q2 CY2026, with sales falling 24.3% year on year to $60.8 million. Its non-GAAP profit of $0.05 per share was significantly above analysts’ consensus estimates.
Is now the time to buy Inspired? Find out by accessing our full research report, it’s free.
Inspired (INSE) Q2 CY2026 Highlights:
- Revenue: $60.8 million vs analyst estimates of $62.45 million (24.3% year-on-year decline, 2.6% miss)
- Adjusted EPS: $0.05 vs analyst estimates of -$0.01 (significant beat)
- Adjusted EBITDA: $27.1 million vs analyst estimates of $26.68 million (44.6% margin, 1.6% beat)
- Operating Margin: 16.3%, up from 9.8% in the same quarter last year
- Free Cash Flow was -$2.8 million, down from $3 million in the same quarter last year
- Market Capitalization: $183.3 million
“Our second quarter results provide clear evidence that our transformation is translating into expanding margins and continued earnings growth, while building a stronger, more cash-generative business with lower leverage,” said Brooks Pierce, President and CEO of Inspired Entertainment.
Company Overview
Specializing in digital casino gaming, Inspired (NASDAQ: INSE) is a provider of gaming hardware, virtual sports platforms, and server-based gaming systems.
Revenue Growth
A company’s long-term sales performance can indicate its overall quality. Any business can experience short-term success, but top-performing ones enjoy sustained growth for years. Regrettably, Inspired’s sales grew at a weak 7.5% compounded annual growth rate over the last five years. This was below our standard for the consumer discretionary sector and is a rough starting point for our analysis.
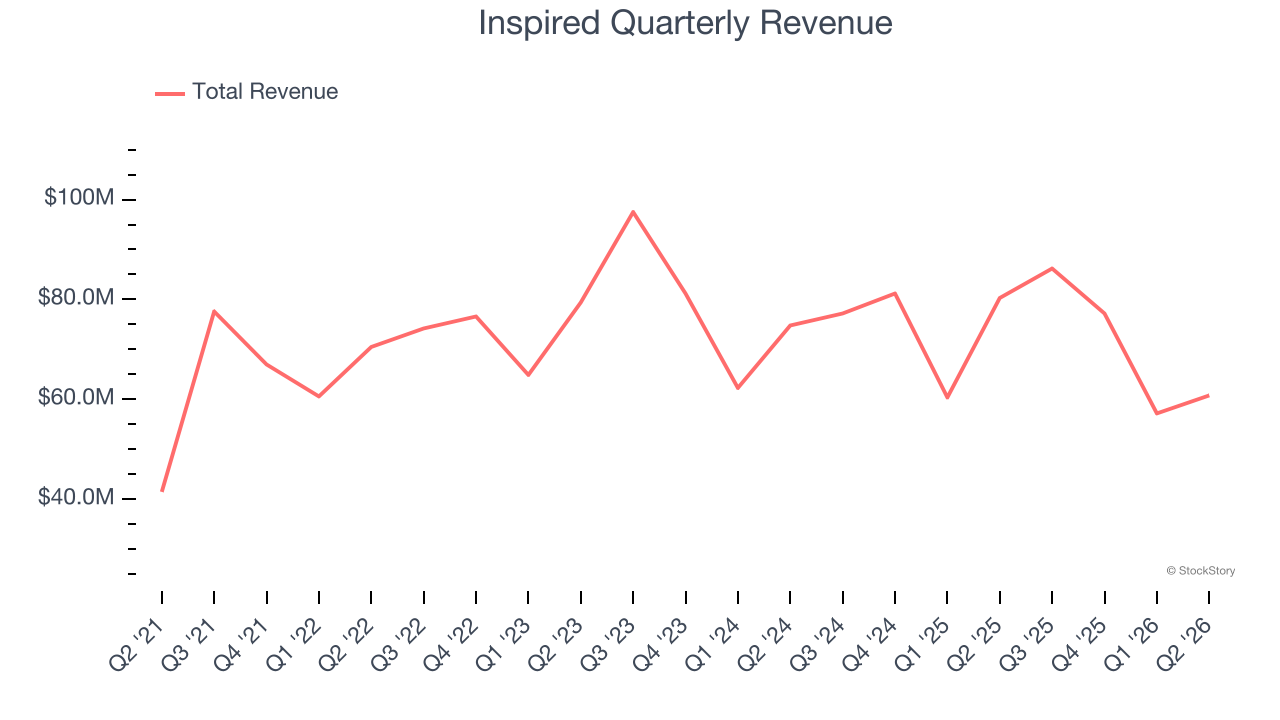
We at StockStory place the most emphasis on long-term growth, but within consumer discretionary, a stretched historical view may miss a company riding a successful new product or trend. Inspired’s performance shows it grew in the past but relinquished its gains over the last two years, as its revenue fell by 5.6% annually. 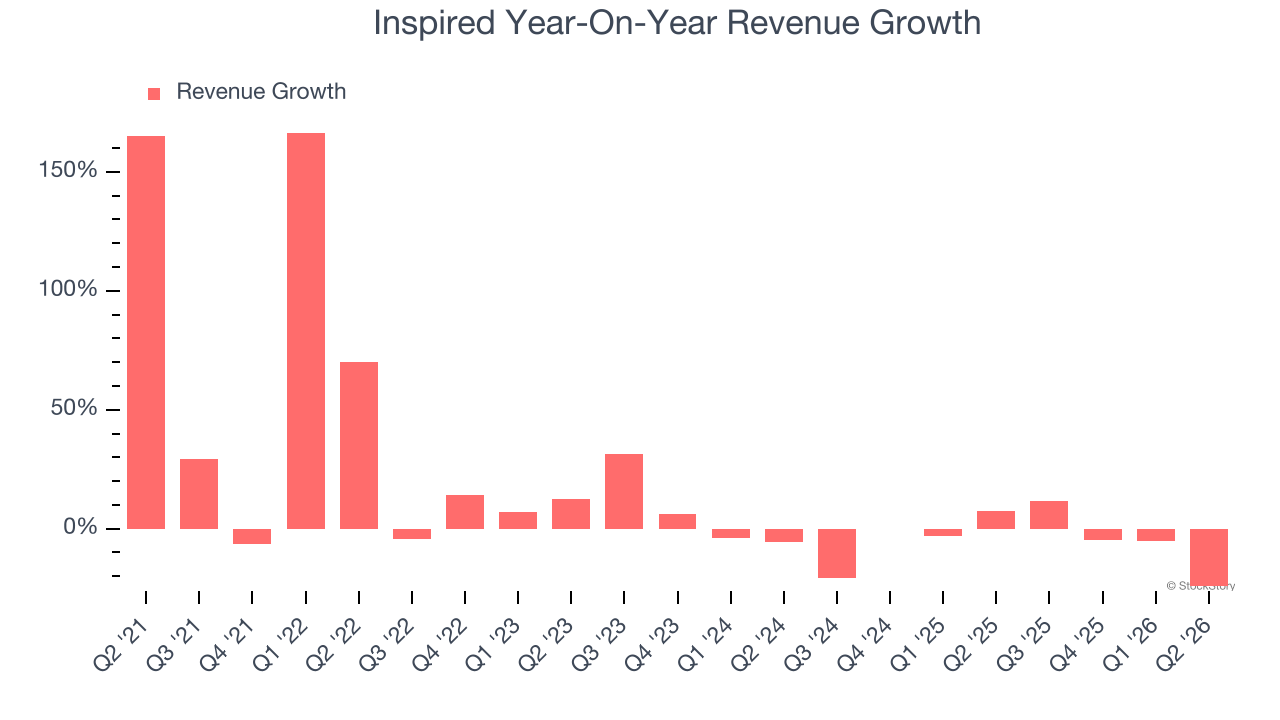
Inspired also breaks out the revenue for its three most important segments: Gaming, Leisure, and Virtual Sports, which are 59.5%, 14.6%, and 25.8% of revenue. Over the last two years, Inspired’s Gaming (land-based casino games) and Virtual Sports (digital gaming and sports betting) revenues averaged year-on-year growth of 6.6% and 80.1%. On the other hand, its Leisure revenue (gaming terminals and amusement machines) averaged 50.6% declines. 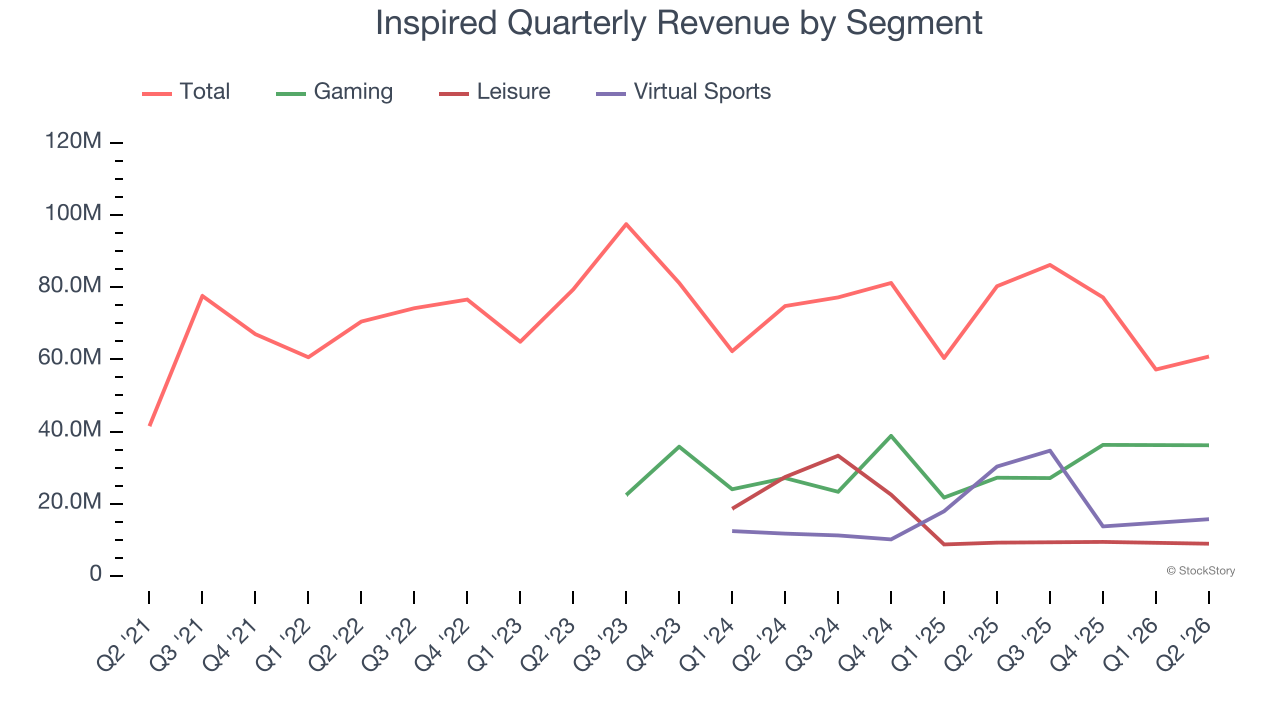
This quarter, Inspired missed Wall Street’s estimates and reported a rather uninspiring 24.3% year-on-year revenue decline, generating $60.8 million of revenue.
Looking ahead, sell-side analysts expect revenue to decline by 6.9% over the next 12 months, similar to its two-year rate. This projection is underwhelming and suggests its products and services will see some demand headwinds.
ONE MORE THING: The $21 AI Application Stock Wall Street Forgot. While Wall Street obsesses over who’s building AI, one company is already using it to print money. And nobody’s paying attention.
AI chip stocks trade at ridiculous valuations. This company processes a trillion consumer signals monthly using AI and trades at a third of the price. The gap won’t last. The institutions will figure it out. You need to see this first. Read the FREE Report Before They Notice.
Operating Margin
Inspired’s operating margin has been trending up over the last 12 months and averaged 12.7% over the last two years. The company’s higher efficiency is a breath of fresh air, but its suboptimal cost structure means it still sports inadequate profitability for a consumer discretionary business.
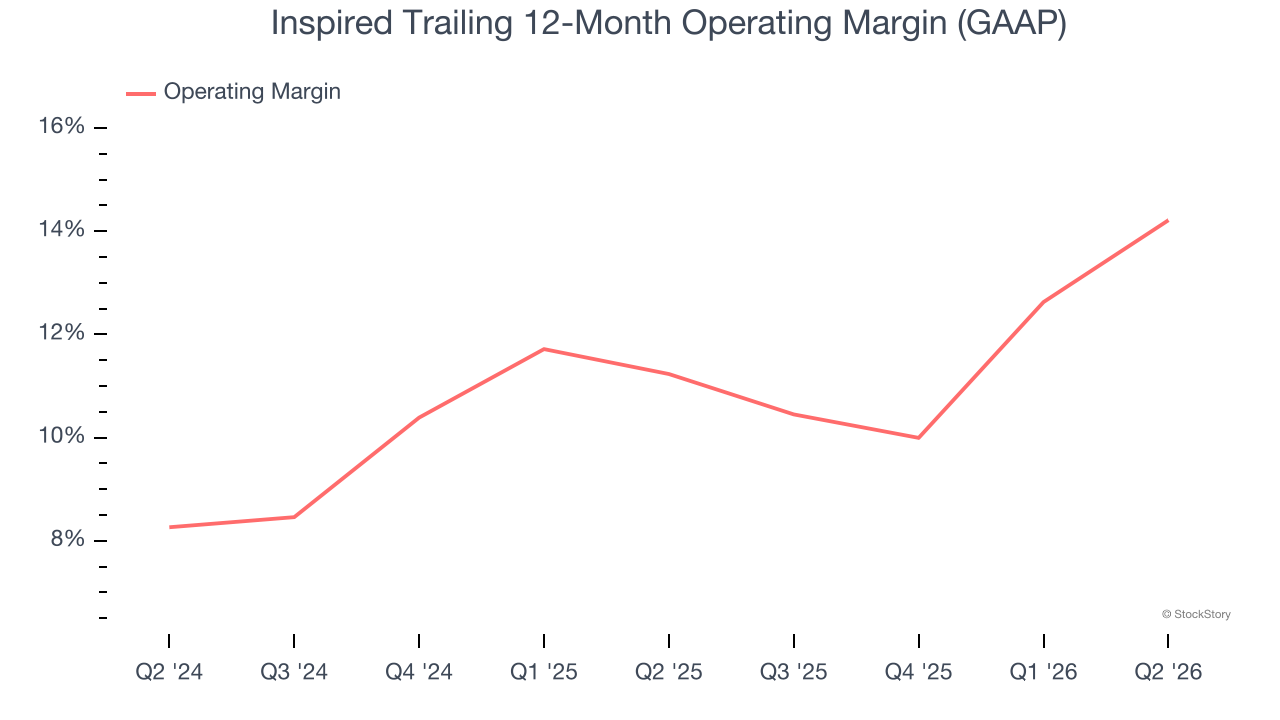
In Q2, Inspired generated an operating margin profit margin of 16.3%, up 6.4 percentage points year on year. This increase was a welcome development, especially since its revenue fell, showing it was more efficient because it scaled down its expenses.
Earnings Per Share
Revenue trends explain a company’s historical growth, but the long-term change in earnings per share (EPS) points to the profitability of that growth — for example, a company could inflate its sales through excessive spending on advertising and promotions.
Sadly for Inspired, its EPS declined by 29.1% annually over the last five years while its revenue grew by 7.5%. However, its operating margin actually improved during this time, telling us that non-fundamental factors such as interest expenses and taxes affected its ultimate earnings.
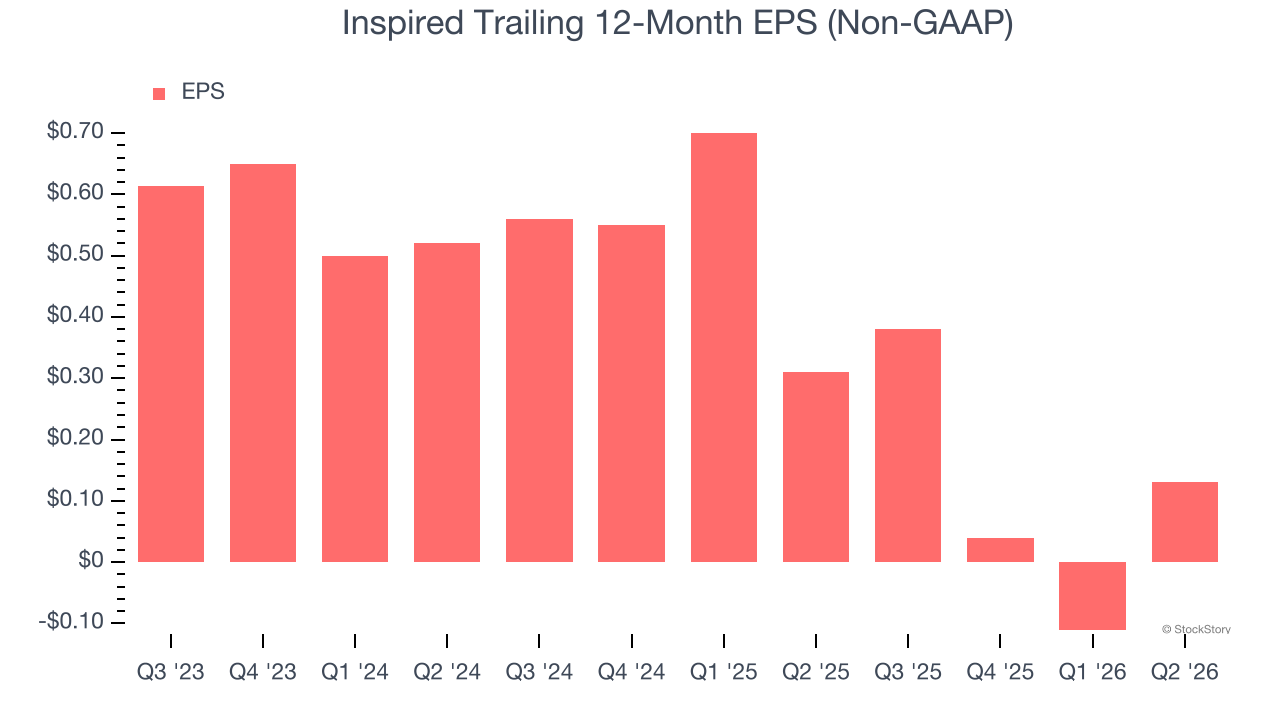
In Q2, Inspired reported adjusted EPS of $0.05, up from negative $0.19 in the same quarter last year. This print easily cleared analysts’ estimates, and shareholders should be content with the results. Over the next 12 months, Wall Street expects Inspired’s full-year EPS to grow 175% from $0.13 to $0.36.
Key Takeaways from Inspired’s Q2 Results
It was good to see Inspired beat analysts’ EPS expectations this quarter. On the other hand, its revenue missed. Overall, this print had some key positives. The stock remained flat at $6.96 immediately following the results.
So should you invest in Inspired right now? The latest quarter does matter, but not nearly as much as longer-term fundamentals and valuation, when deciding if the stock is a buy. We cover that in our actionable full research report which you can read here (it’s free).