
Title insurance company Fidelity National Financial (NYSE: FNF) reported revenue ahead of Wall Street’s expectations in Q2 CY2026, with sales up 11.4% year on year to $4.05 billion. Its non-GAAP profit of $1.39 per share was 5.4% above analysts’ consensus estimates.
Is now the time to buy Fidelity National Financial? Find out by accessing our full research report, it’s free.
Fidelity National Financial (FNF) Q2 CY2026 Highlights:
- Revenue: $4.05 billion vs analyst estimates of $3.83 billion (11.4% year-on-year growth, 5.8% beat)
- Pre-tax Profit: $338 million (8.3% margin)
- Adjusted EPS: $1.39 vs analyst estimates of $1.32 (5.4% beat)
- Market Capitalization: $13.86 billion
Conor Murphy, F&G's Chief Executive Officer and President, commented, "The second quarter reflects the strength and resilience of the business we have built at F&G. We achieved record assets under management before reinsurance of $74.7 billion underpinned by continued momentum in core retail, while maintaining our disciplined approach to sales, pricing and capital allocation. Our investment portfolio continues to perform well, with strong credit performance and impairments remaining below pricing assumptions, reinforcing the consistent earnings power of our business. Combined with our diversified distribution platform and strategic reinsurance relationships, we believe F&G is well positioned to navigate a dynamic market environment."
Company Overview
Issuing more title insurance policies than any other company in the United States, Fidelity National Financial (NYSE: FNF) provides title insurance and escrow services for real estate transactions while also offering annuities and life insurance through its F&G subsidiary.
Revenue Growth
Big picture, insurers generate revenue from three key sources. The first is the core business of underwriting policies. The second source is income from investing the “float” (premiums collected upfront not yet paid out as claims) in assets such as fixed-income assets and equities. The third is fees from various sources such as policy administration, annuities, or other value-added services. Unfortunately, Fidelity National Financial’s 2.3% annualized revenue growth over the last five years was sluggish. This was below our standards and is a rough starting point for our analysis.
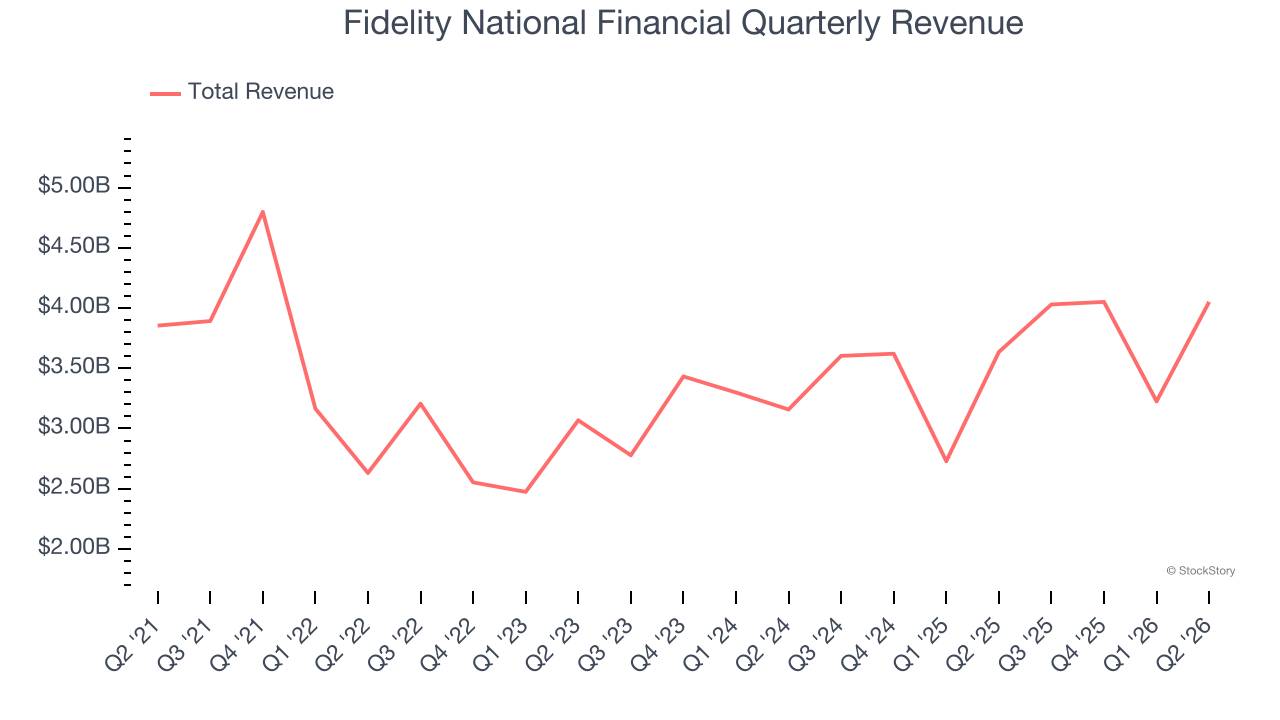
We at StockStory place the most emphasis on long-term growth, but within financials, a half-decade historical view may miss recent interest rate changes, market returns, and industry trends. Fidelity National Financial’s annualized revenue growth of 10.1% over the last two years is above its five-year trend, suggesting its demand recently accelerated. 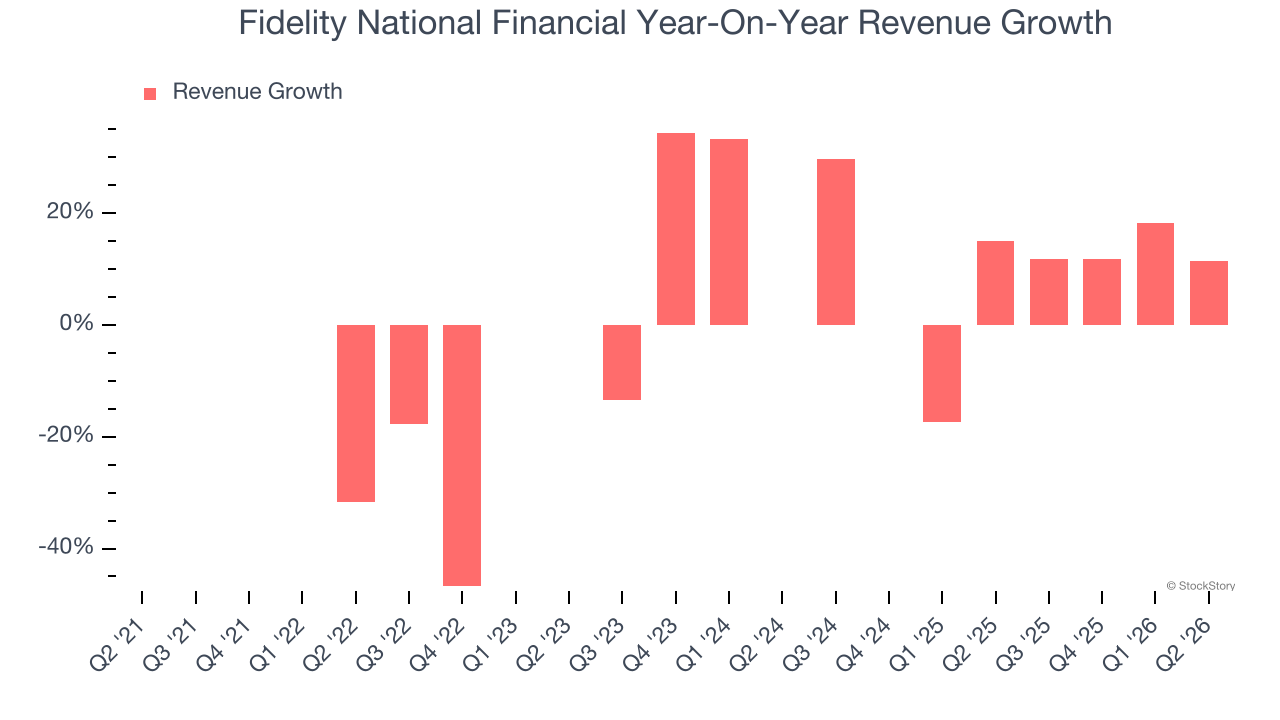 Note: Quarters not shown were determined to be outliers because they were impacted by outsized investment gains/losses that are not indicative of the recurring fundamentals of the business.
This quarter, Fidelity National Financial reported year-on-year revenue growth of 11.4%, and its $4.05 billion of revenue exceeded Wall Street’s estimates by 5.8%.
Net premiums earned made up 44.8% of the company’s total revenue during the last five years, meaning Fidelity National Financial’s growth drivers strike a balance between insurance and non-insurance activities.
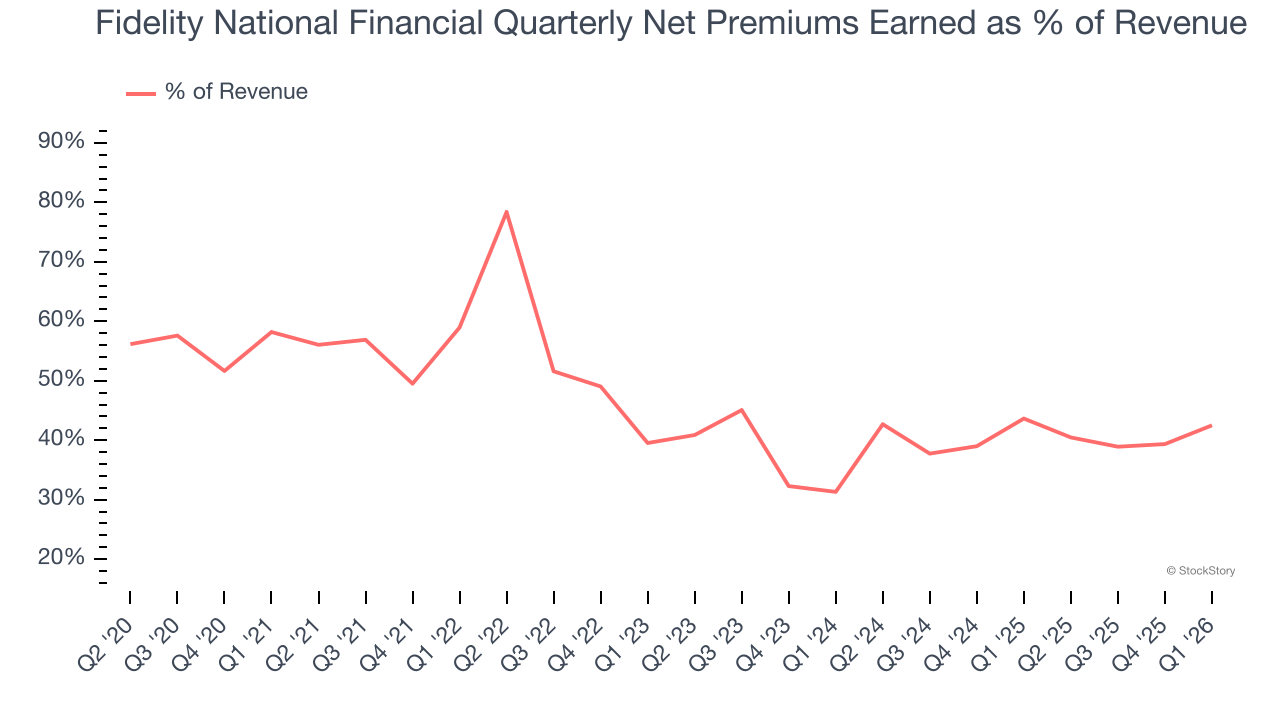
Markets consistently prioritize net premiums earned growth over investment and fee income, recognizing its superior quality as a core indicator of the company’s underwriting success and market penetration.
ALSO WORTH WATCHING: Nvidia’s Quiet Partner. Nvidia’s chips cost a hundred grand. The connectors that make them work cost even more. One company makes them all.
Every AI server needs specialized infrastructure the chip companies don’t make. High-speed cables. Power connectors. Thermal sensors. This 90-year-old company built a monopoly on it. The AI boom just started. This stock is still flying under the radar. Claim The Stock Ticker Here for FREE.
Net Premiums Earned
When insurers sell policies, they protect themselves from extremely large losses or an outsized accumulation of losses with reinsurance (insurance for insurance companies). Net premiums earned are therefore gross premiums less what’s ceded to reinsurers as a risk mitigation and transfer strategy.
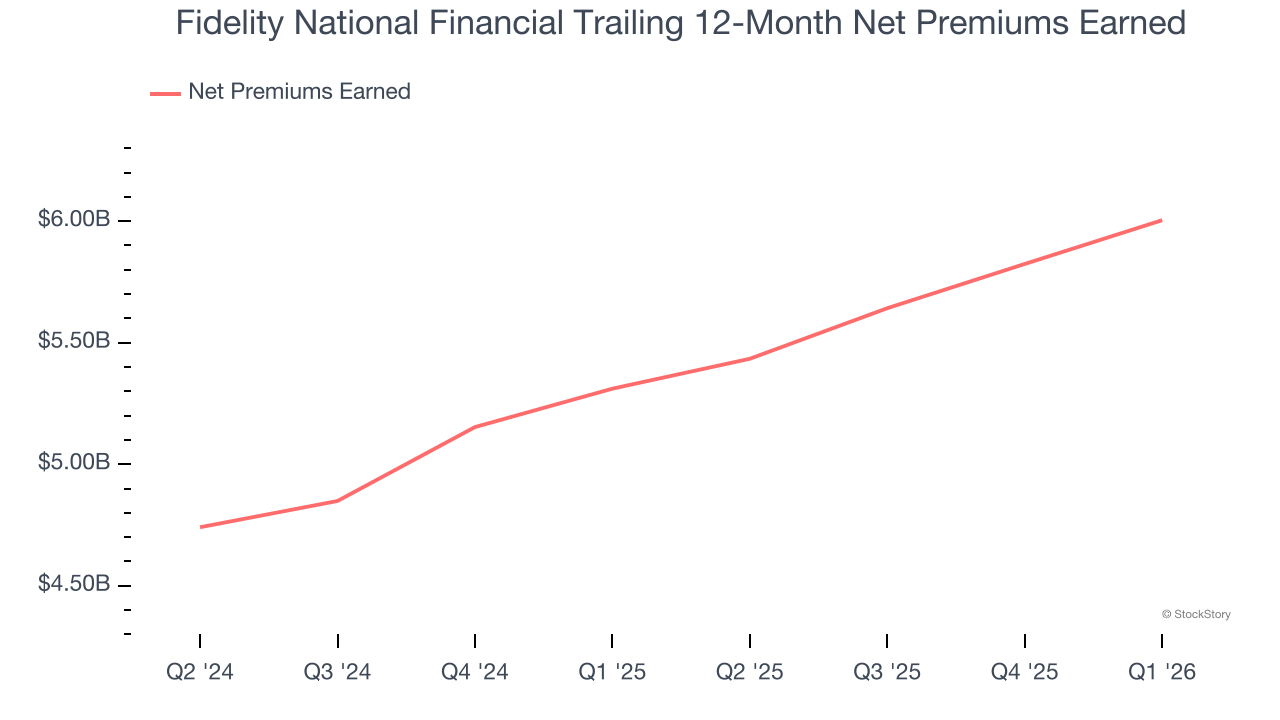
Fidelity National Financial’s net premiums earned has declined by 3.7% annually over the last five years, much worse than the broader insurance industry. This shows that policy underwriting underperformed its other business lines.
When analyzing Fidelity National Financial’s net premiums earned over the last two years, we can see that growth accelerated to 15.6% annually. Since two-year net premiums earned grew faster than total revenue over this period, it’s implied that other line items such as investment income grew at a slower rate. While these supplementary streams affect the bottom line, their contribution can fluctuate. Some firms have been more successful and consistent in investing their float over the long term, but sharp movements in the fixed income and equity markets can play a substantial role in short-term performance.
Key Takeaways from Fidelity National Financial’s Q2 Results
We were impressed by how significantly Fidelity National Financial blew past analysts’ revenue expectations this quarter. Overall, we think this was a solid quarter with some key areas of upside. The stock remained flat at $51.14 immediately following the results.
Fidelity National Financial had an encouraging quarter, but one earnings result doesn’t necessarily make the stock a buy. Let’s see if this is a good investment. When making that decision, it’s important to consider its valuation, business qualities, as well as what has happened in the latest quarter. We cover that in our actionable full research report which you can read here (it’s free).