Dental products company Envista Holdings (NYSE: NVST) reported Q2 CY2026 results exceeding the market’s revenue expectations, with sales up 7.1% year on year to $730.5 million. Its non-GAAP profit of $0.41 per share was 22.1% above analysts’ consensus estimates.
Is now the time to buy Envista? Find out by accessing our full research report, it’s free.
Envista (NVST) Q2 CY2026 Highlights:
- Revenue: $730.5 million vs analyst estimates of $716.3 million (7.1% year-on-year growth, 2% beat)
- Adjusted EPS: $0.41 vs analyst estimates of $0.34 (22.1% beat)
- Adjusted EBITDA: $108 million vs analyst estimates of $97.02 million (14.8% margin, 11.3% beat)
- Management raised its full-year Adjusted EPS guidance to $1.53 at the midpoint, a 8.9% increase
- Operating Margin: 11%, up from 6.8% in the same quarter last year
- Free Cash Flow Margin: 14.3%, up from 11.2% in the same quarter last year
- Market Capitalization: $4.55 billion
"We built on our fast start in Q1 with continued good performance in Q2," said Paul Keel, CEO.
Company Overview
Uniting more than 30 trusted brands including Nobel Biocare, Ormco, and DEXIS under one corporate umbrella, Envista Holdings (NYSE: NVST) is a global dental products company that provides equipment, consumables, and specialized technologies for dental professionals.
Revenue Growth
A company’s long-term sales performance is one signal of its overall quality. Any business can put up a good quarter or two, but the best consistently grow over the long haul. Unfortunately, Envista’s 3.4% annualized revenue growth over the last five years was tepid. This fell short of our benchmark for the healthcare sector and is a rough starting point for our analysis.
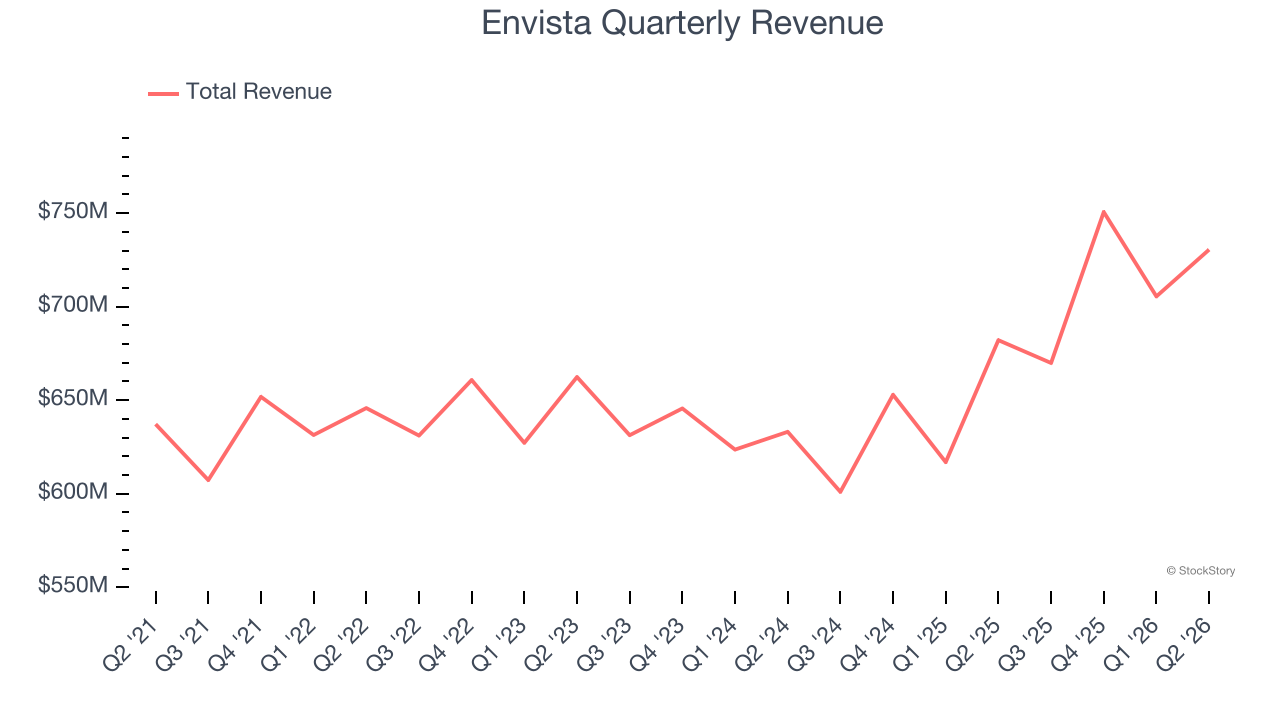
Long-term growth is the most important, but within healthcare, a half-decade historical view may miss new innovations or demand cycles. Envista’s annualized revenue growth of 6.2% over the last two years is above its five-year trend, which is encouraging. 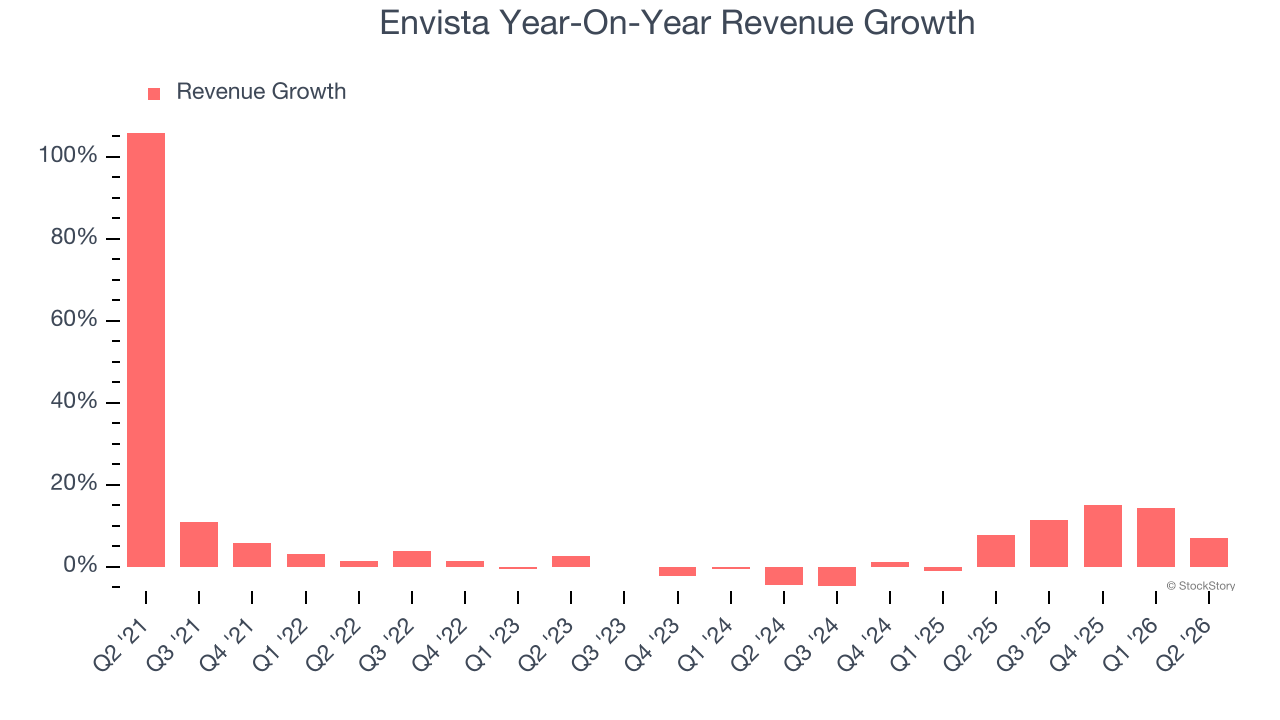
This quarter, Envista reported year-on-year revenue growth of 7.1%, and its $730.5 million of revenue exceeded Wall Street’s estimates by 2%.
Looking ahead, sell-side analysts expect revenue to grow 1.1% over the next 12 months, a deceleration versus the last two years. This projection is underwhelming and suggests its products and services will face some demand challenges.
WHILE YOU’RE HERE: The Next Palantir? One satellite company captures images of every point on Earth. Every single day. The Pentagon wants it. Hedge funds are using it to beat earnings. You’ve probably never heard of it.
This is what the early days of Palantir looked like before it became a giant. Same playbook. Different technology. If you missed Palantir, you need to see this. Claim The Stock Ticker for Free HERE.
Adjusted Operating Margin
Adjusted operating margin is an important measure of profitability as it shows the portion of revenue left after accounting for all core expenses — everything from the cost of goods sold to advertising and wages. It’s also useful for comparing profitability across companies because it excludes non-recurring expenses, interest on debt, and taxes.
Envista has done a decent job managing its cost base over the last five years. The company has produced an average adjusted operating margin of 14.5%, higher than the broader healthcare sector.
Analyzing the trend in its profitability, Envista’s adjusted operating margin decreased by 5.2 percentage points over the last five years. This raises questions about the company’s expense base because its revenue growth should have given it leverage on its fixed costs, resulting in better economies of scale and profitability.
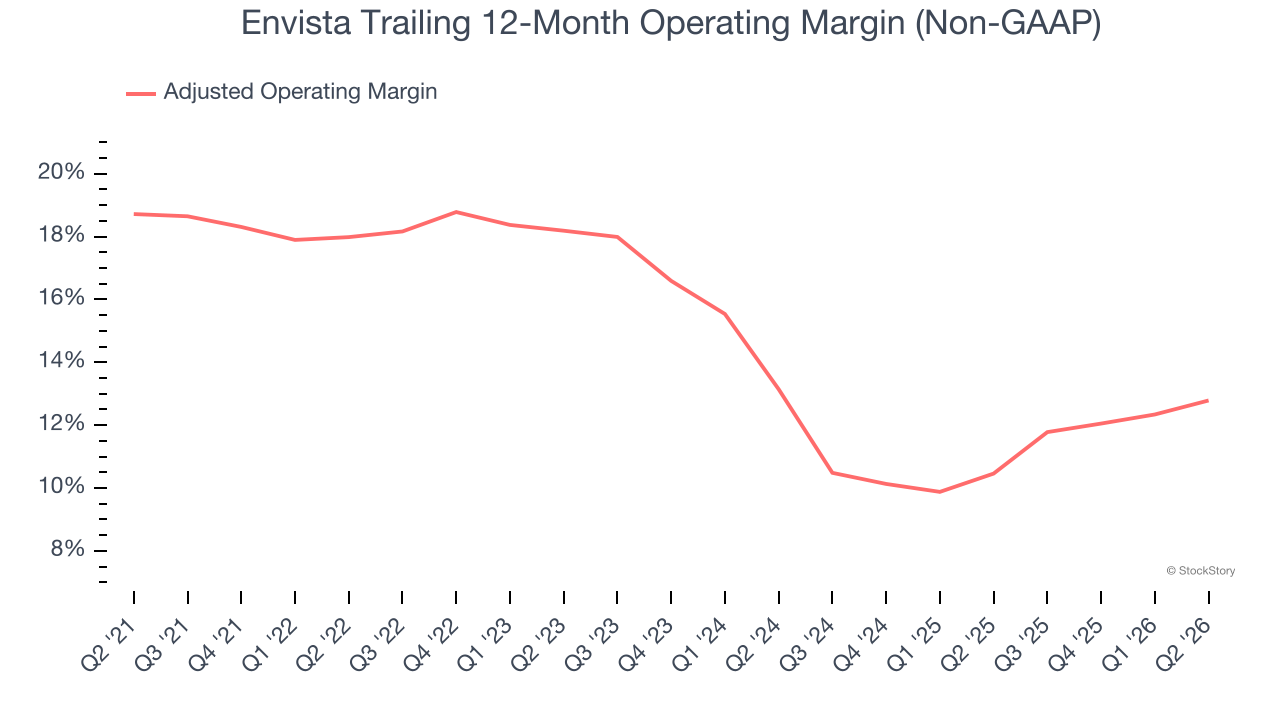
This quarter, Envista generated an adjusted operating margin profit margin of 12.3%, up 1.9 percentage points year on year. This increase was a welcome development and shows it was more efficient.
Earnings Per Share
We track the long-term change in earnings per share (EPS) for the same reason as long-term revenue growth. Compared to revenue, however, EPS highlights whether a company’s growth is profitable.
Sadly for Envista, its EPS declined by 7% annually over the last five years while its revenue grew by 3.4%. This tells us the company became less profitable on a per-share basis as it expanded due to non-fundamental factors such as interest expenses and taxes.
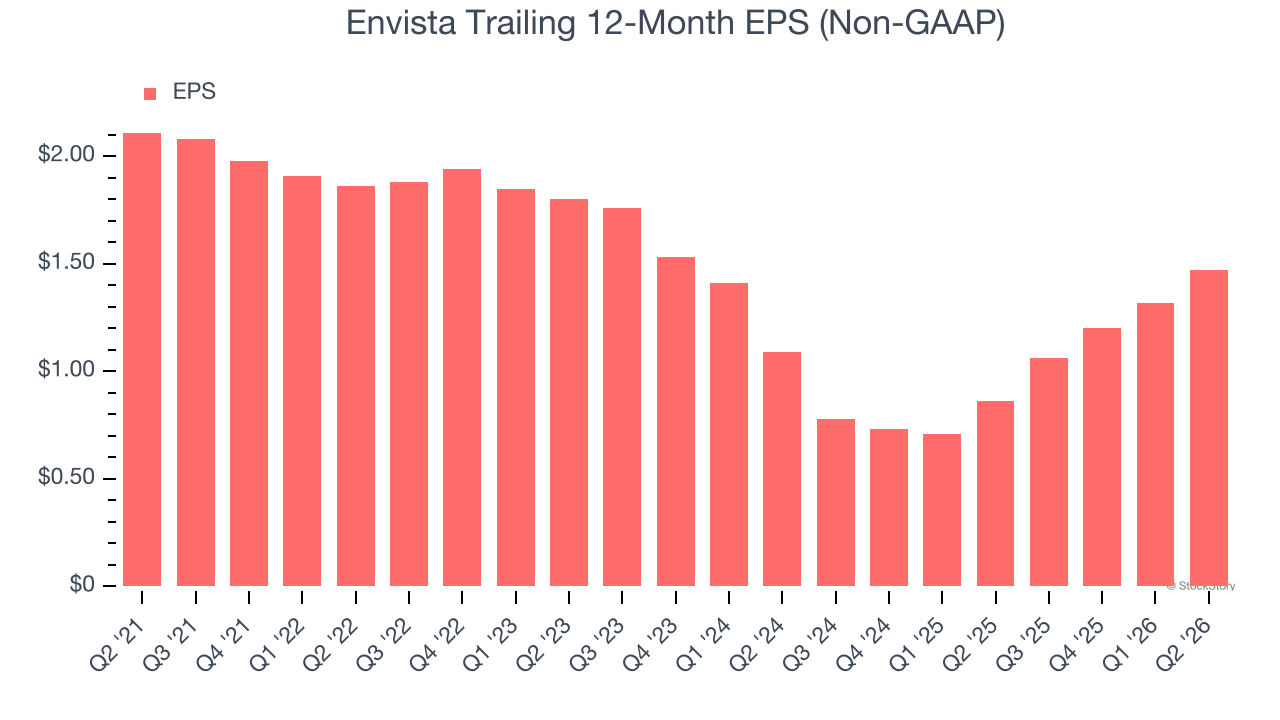
We can take a deeper look into Envista’s earnings to better understand the drivers of its performance. As we mentioned earlier, Envista’s adjusted operating margin expanded this quarter but declined by 5.2 percentage points over the last five years. This was the most relevant factor (aside from the revenue impact) behind its lower earnings; interest expenses and taxes can also affect EPS but don’t tell us as much about a company’s fundamentals.
In Q2, Envista reported adjusted EPS of $0.41, up from $0.26 in the same quarter last year. This print easily cleared analysts’ estimates, and shareholders should be content with the results. Over the next 12 months, Wall Street expects Envista’s full-year EPS to stay about the same, moving from $1.47 to $1.47.
Key Takeaways from Envista’s Q2 Results
We were impressed by how significantly Envista blew past analysts’ EPS expectations this quarter. We were also glad its guidance for FY EPS was raised above Wall Street’s estimates. Zooming out, we think this was a solid print. The stock traded up 1% to $28.95 immediately following the results.
Envista had an encouraging quarter, but one earnings result doesn’t necessarily make the stock a buy. Let’s see if this is a good investment. What happened in the latest quarter matters, but not as much as longer-term business quality and valuation, when deciding whether to invest in this stock. We cover that in our actionable full research report which you can read here (it’s free).