Payment technology company Crane NXT (NYSE: CXT) met Wall Street’s revenue expectations in Q2 CY2026, with sales up 22% year on year to $493.2 million. Its non-GAAP profit of $1.10 per share was 6.3% above analysts’ consensus estimates.
Is now the time to buy Crane NXT? Find out by accessing our full research report, it’s free.
Crane NXT (CXT) Q2 CY2026 Highlights:
- Revenue: $493.2 million vs analyst estimates of $493.1 million (22% year-on-year growth, in line)
- Adjusted EPS: $1.10 vs analyst estimates of $1.04 (6.3% beat)
- Adjusted EBITDA: $115.5 million vs analyst estimates of $116 million (23.4% margin, in line)
- Management raised its full-year Adjusted EPS guidance to $4.32 at the midpoint, a 1.6% increase
- Operating Margin: 14%, up from 11.8% in the same quarter last year
- Free Cash Flow Margin: 14.9%, down from 16.7% in the same quarter last year
- Backlog: $755.5 million at quarter end, up 27.7% year on year
- Market Capitalization: $3.15 billion
Aaron W. Saak, Crane NXT's President and Chief Executive Officer, stated: “We had strong operational performance in Q2, delivering on our value creation priorities of accelerating growth, building on our leadership positions, and driving operational excellence. With our strong first-half performance, and expected continued momentum, we are raising our full-year Adjusted EPS guidance to a range of $4.22 to $4.42.”
Company Overview
Born from a corporate transformation completed in 2023, Crane NXT (NYSE: CXT) provides specialized technology solutions for payment processing, banknote security, and authentication systems for financial institutions and businesses.
Revenue Growth
Examining a company’s long-term performance can provide clues about its quality. Even a bad business can shine for one or two quarters, but a top-tier one grows for years.
With $1.80 billion in revenue over the past 12 months, Crane NXT is a mid-sized business services company, which sometimes brings disadvantages compared to larger competitors benefiting from better economies of scale. On the bright side, it can still flex high growth rates because it’s working from a smaller revenue base.
As you can see below, Crane NXT grew its sales at a solid 7.2% compounded annual growth rate over the last four years. This is an encouraging starting point for our analysis because it shows Crane NXT’s demand was higher than many business services companies.
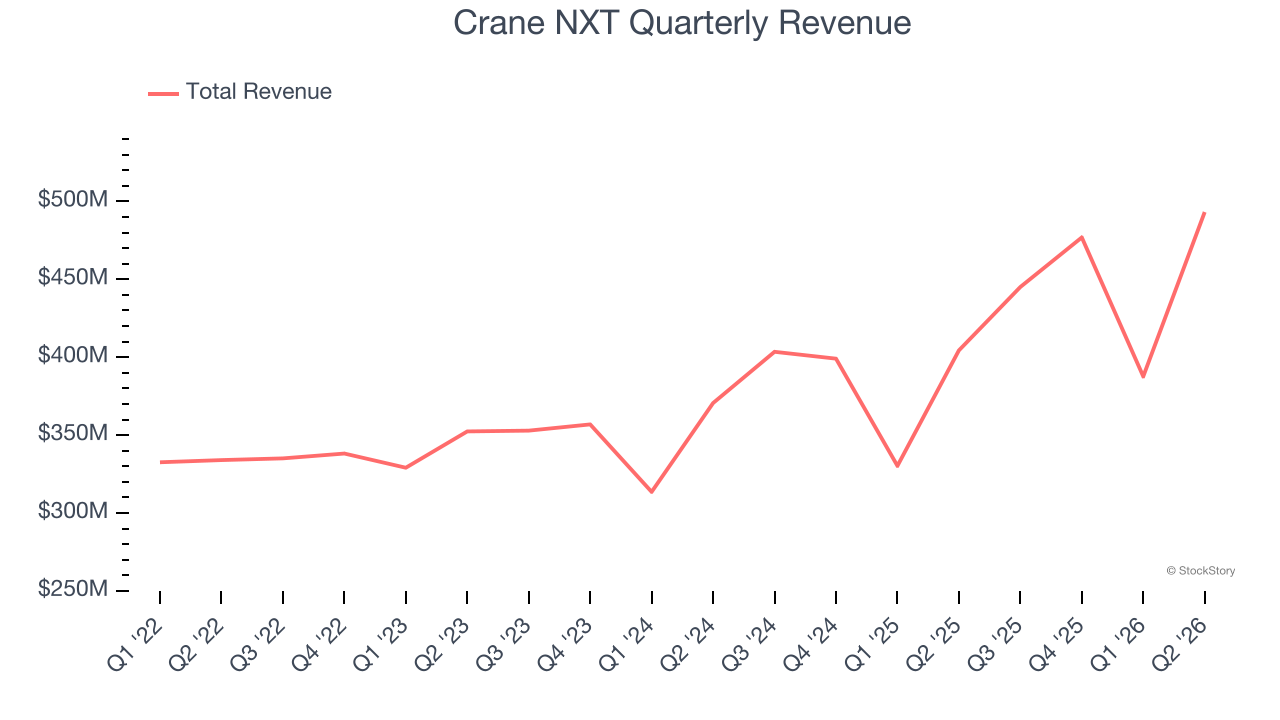
Long-term growth is the most important, but within business services, a stretched historical view may miss new innovations or demand cycles. Crane NXT’s annualized revenue growth of 13.7% over the last two years is above its four-year trend, suggesting its demand was strong and recently accelerated. 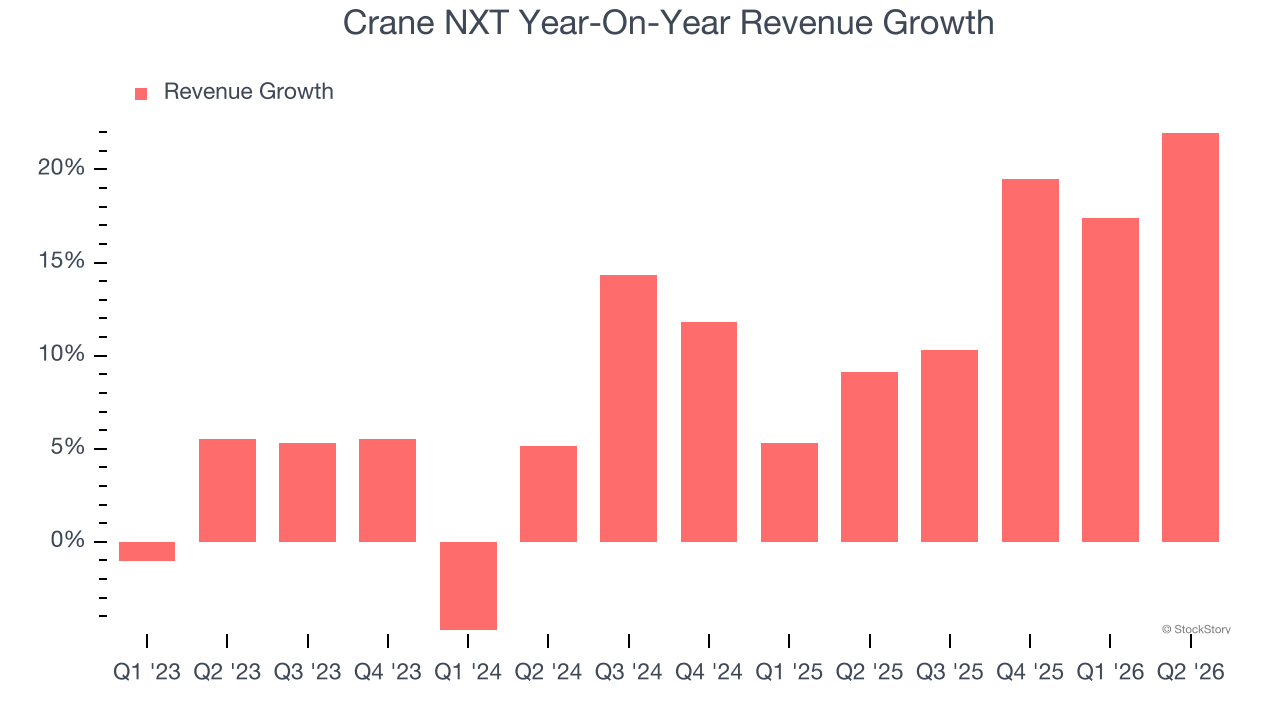
We can dig further into the company’s revenue dynamics by analyzing its backlog, or the value of its outstanding orders that have not yet been executed or delivered. Crane NXT’s backlog reached $755.5 million in the latest quarter and averaged 17.1% year-on-year growth over the last two years. Because this number is better than its revenue growth, we can see the company accumulated more orders than it could fulfill and deferred revenue to the future. This could imply elevated demand for Crane NXT’s products and services but raises concerns about capacity constraints. 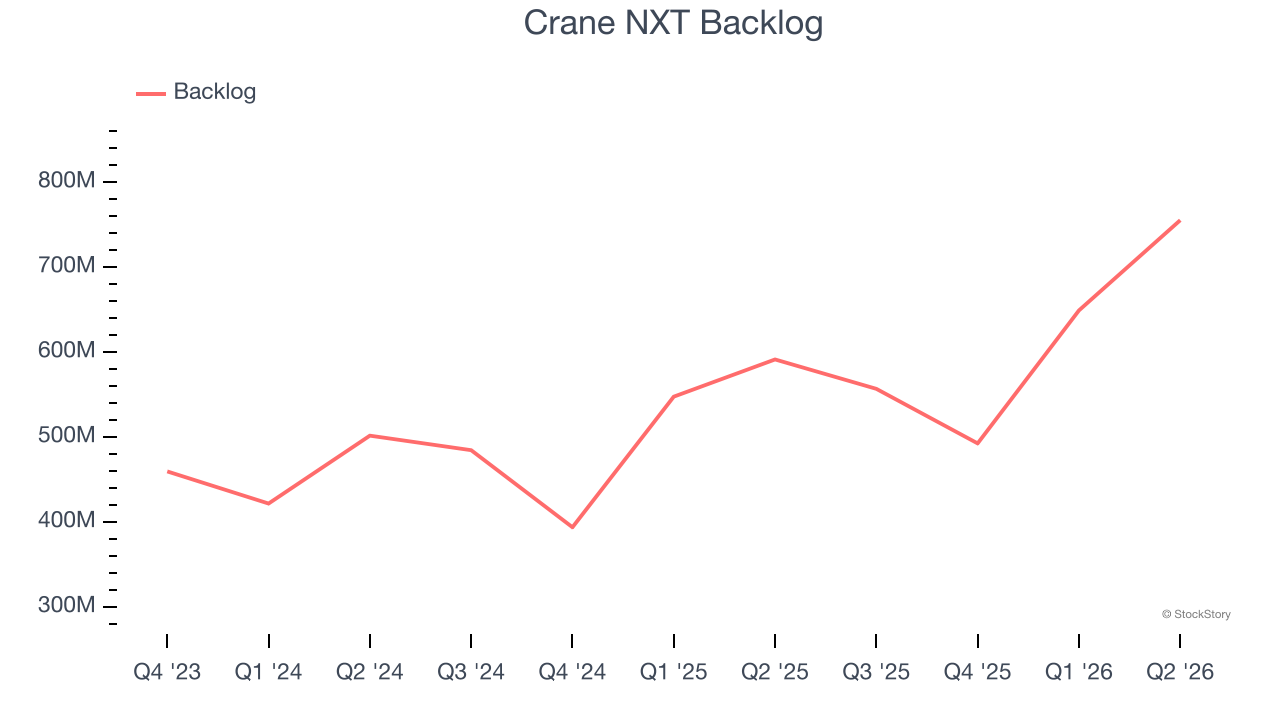
This quarter, Crane NXT’s year-on-year revenue growth of 22% was excellent, and its $493.2 million of revenue was in line with Wall Street’s estimates.
Looking ahead, sell-side analysts expect revenue to grow 11.4% over the next 12 months, a slight deceleration versus the last two years. Still, this projection is admirable and implies the market is forecasting success for its products and services.
ONE MORE THING: 3 Hidden Platforms Growing 3X Faster than Amazon, Google, and PayPal. Amazon, Google, and Meta all followed the same playbook: Dominate an ignored market. Build an unbeatable moat. Scale until you’re unstoppable.
These three platforms are running that exact playbook right now. The early investors in Amazon made fortunes. The early investors in these could do the same. Get All 3 Stocks Here for FREE.
Adjusted Operating Margin
Adjusted operating margin is one of the best measures of profitability because it tells us how much money a company takes home after subtracting all core expenses, like marketing and R&D. It also removes various one-time costs to paint a better picture of normalized profits.
Crane NXT has been a well-oiled machine over the last five years. It demonstrated elite profitability for a business services business, boasting an average adjusted operating margin of 22.6%.
Analyzing the trend in its profitability, Crane NXT’s adjusted operating margin decreased by 10 percentage points over the last five years. This raises questions about the company’s expense base because its revenue growth should have given it leverage on its fixed costs, resulting in better economies of scale and profitability.
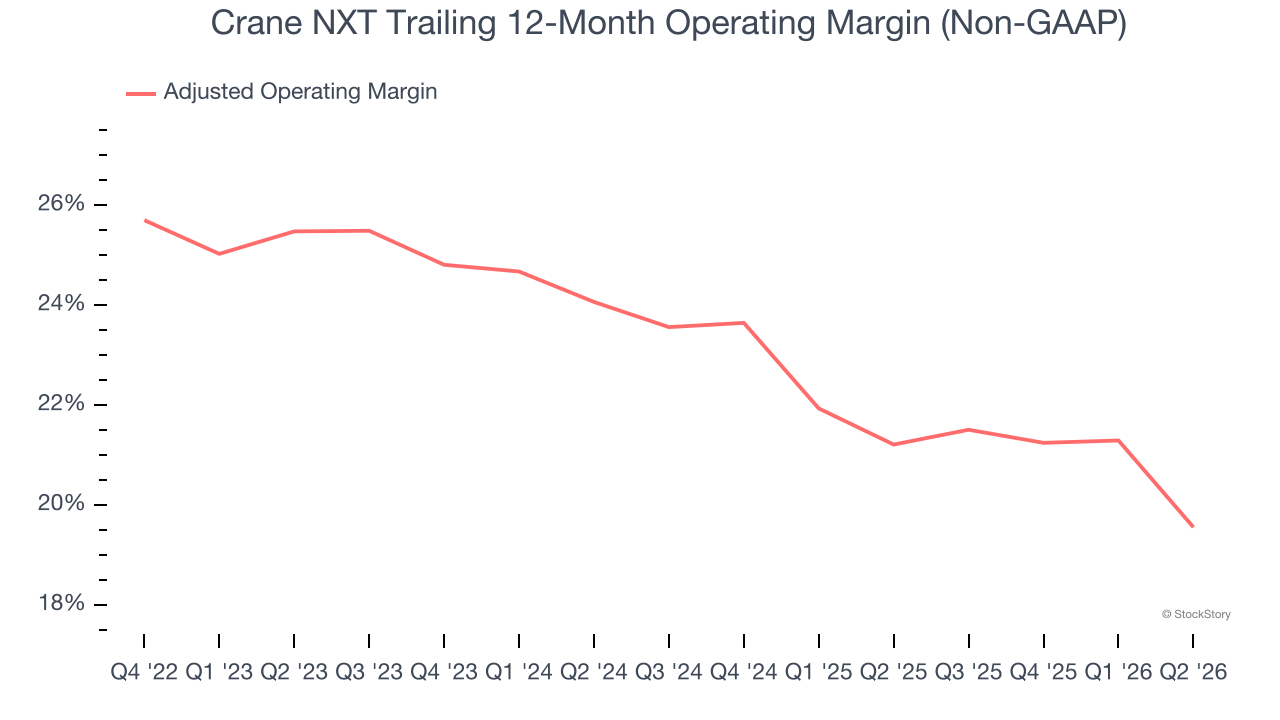
This quarter, Crane NXT generated an adjusted operating margin profit margin of 14.9%, down 6.3 percentage points year on year. This contraction shows it was less efficient because its expenses grew faster than its revenue.
Cash Is King
If you’ve followed StockStory for a while, you know we emphasize free cash flow. Why, you ask? We believe that in the end, cash is king, and you can’t use accounting profits to pay the bills.
Crane NXT has shown terrific cash profitability, enabling it to reinvest, return capital to investors, and stay ahead of the competition while maintaining an ample cushion. The company’s free cash flow margin was among the best in the business services sector, averaging 15% over the last five years.
Taking a step back, we can see that Crane NXT’s margin dropped by 10.8 percentage points during that time. It may have ticked higher more recently, but shareholders are likely hoping for its margin to at least revert to its historical level. If the longer-term trend returns, it could signal it is in the middle of an investment cycle.
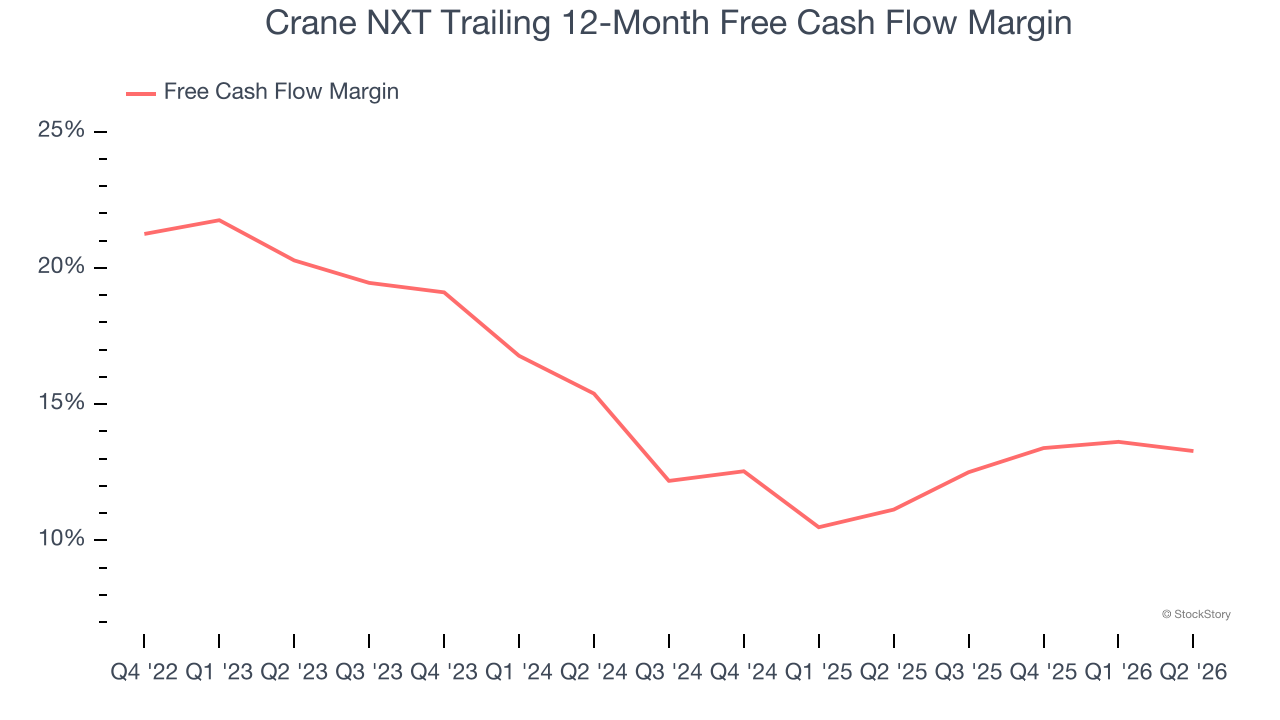
Crane NXT’s free cash flow clocked in at $73.4 million in Q2, equivalent to a 14.9% margin. The company’s cash profitability regressed as it was 1.8 percentage points lower than in the same quarter last year, which isn’t ideal considering its longer-term trend.
Key Takeaways from Crane NXT’s Q2 Results
It was good to see Crane NXT beat analysts’ EPS expectations this quarter despite in-line revenue. We were also happy its full-year EPS guidance outperformed Wall Street’s estimates. Overall, we think this was a solid quarter with some key areas of upside. The stock remained flat at $52.50 immediately after reporting.
Crane NXT may have had a good quarter, but does that mean you should invest right now? If you’re making that decision, you should consider the bigger picture of valuation, business qualities, as well as the latest earnings. We cover that in our actionable full research report which you can read here (it’s free).