Defense, intelligence, and IT solutions provider CACI International (NYSE: CACI) reported Q2 CY2026 results topping the market’s revenue expectations, with sales up 17.6% year on year to $2.71 billion. The company’s full-year revenue guidance of $10.75 billion at the midpoint came in 0.7% above analysts’ estimates. Its non-GAAP profit of $8.91 per share was 23.2% above analysts’ consensus estimates.
Is now the time to buy CACI? Find out by accessing our full research report, it’s free.
CACI (CACI) Q2 CY2026 Highlights:
- Revenue: $2.71 billion vs analyst estimates of $2.69 billion (17.6% year-on-year growth, 0.7% beat)
- Adjusted EPS: $8.91 vs analyst estimates of $7.23 (23.2% beat)
- Adjusted EBITDA: $353.1 million vs analyst estimates of $318.2 million (13% margin, 11% beat)
- Adjusted EPS guidance for the upcoming financial year 2027 is $33.41 at the midpoint, beating analyst estimates by 8.4%
- Operating Margin: 10%, up from 9% in the same quarter last year
- Free Cash Flow Margin: 8.6%, up from 5.6% in the same quarter last year
- Backlog: $32 billion at quarter end, up 3.2% year on year
- Market Capitalization: $11.58 billion
Company Overview
Founded to commercialize SIMSCRIPT, CACI International (NYSE: CACI) offers defense, intelligence, and IT solutions to support national security and government transformation efforts.
Revenue Growth
A company’s long-term sales performance can indicate its overall quality. Any business can put up a good quarter or two, but the best consistently grow over the long haul. Over the last five years, CACI grew its sales at a solid 9.6% compounded annual growth rate. Its growth beat the average industrials company and shows its offerings resonate with customers.
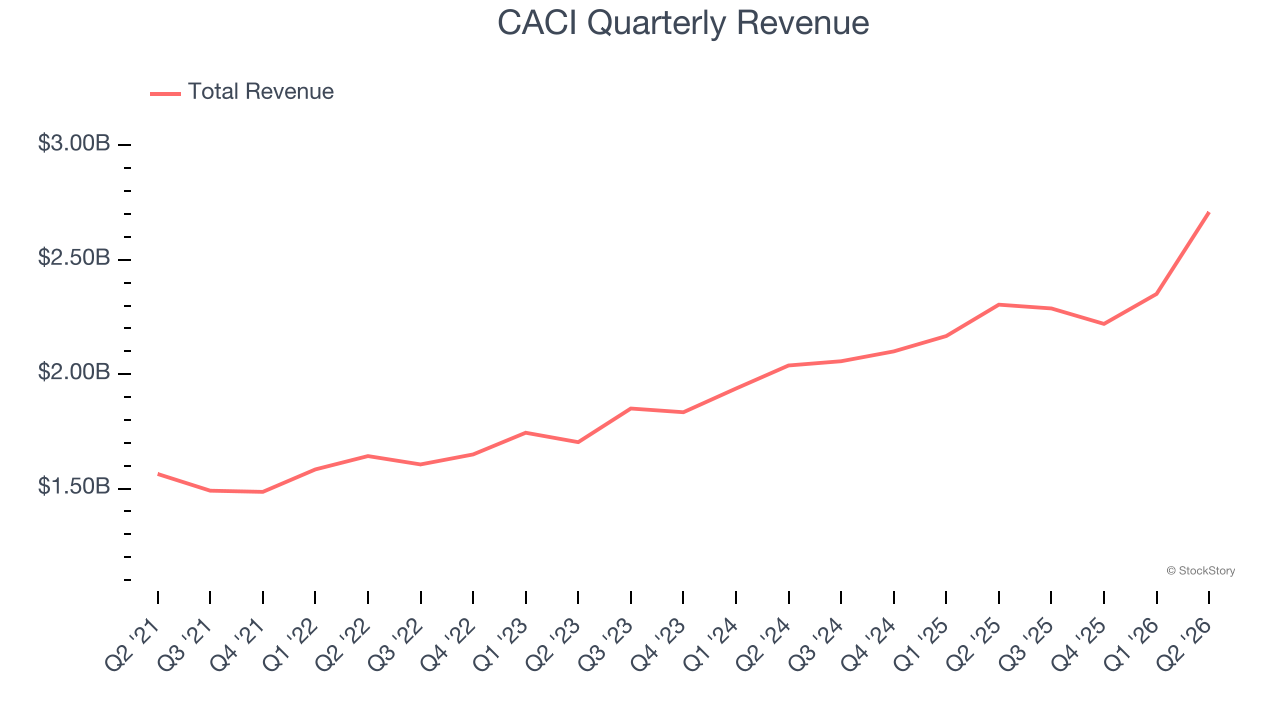
Long-term growth is the most important, but within industrials, a half-decade historical view may miss new industry trends or demand cycles. CACI’s annualized revenue growth of 11.8% over the last two years is above its five-year trend, suggesting its demand was strong and recently accelerated. 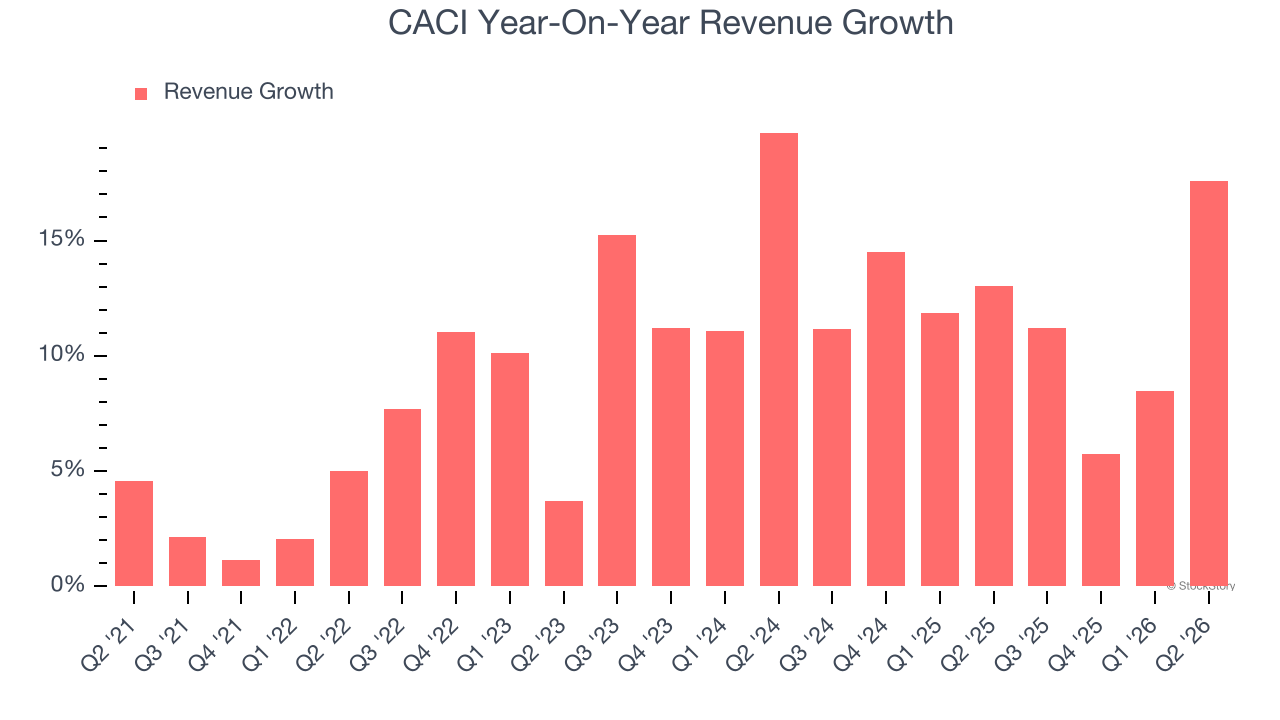
We can dig further into the company’s revenue dynamics by analyzing its backlog, or the value of its outstanding orders that have not yet been executed or delivered. CACI’s backlog reached $32 billion in the latest quarter and averaged 3.5% year-on-year growth over the last two years. Because this number is lower than its revenue growth, we can see the company fulfilled orders at a faster rate than it added new orders to the backlog. This implies CACI was operating efficiently but raises questions about the health of its sales pipeline. 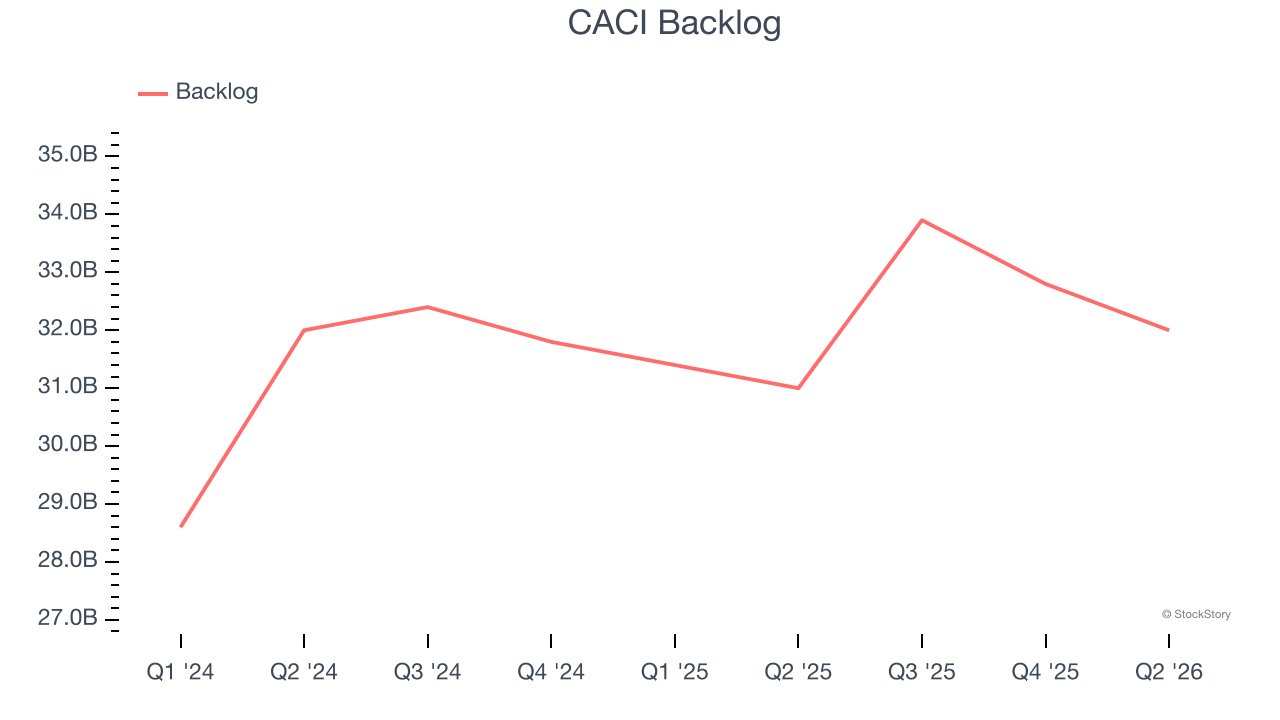
This quarter, CACI reported year-on-year revenue growth of 17.6%, and its $2.71 billion of revenue exceeded Wall Street’s estimates by 0.7%.
Looking ahead, sell-side analysts expect revenue to grow 11.8% over the next 12 months, similar to its two-year rate. This projection is noteworthy and indicates the market sees success for its products and services.
ONE MORE THING: The $21 AI Application Stock Wall Street Forgot. While Wall Street obsesses over who’s building AI, one company is already using it to print money. And nobody’s paying attention.
AI chip stocks trade at ridiculous valuations. This company processes a trillion consumer signals monthly using AI and trades at a third of the price. The gap won’t last. The institutions will figure it out. You need to see this first. Read the FREE Report Before They Notice.
Operating Margin
CACI has done a decent job managing its cost base over the last five years. The company has produced an average operating margin of 8.8%, higher than the broader industrials sector.
Looking at the trend in its profitability, CACI’s operating margin rose by 1.6 percentage points over the last five years, as its sales growth gave it operating leverage.
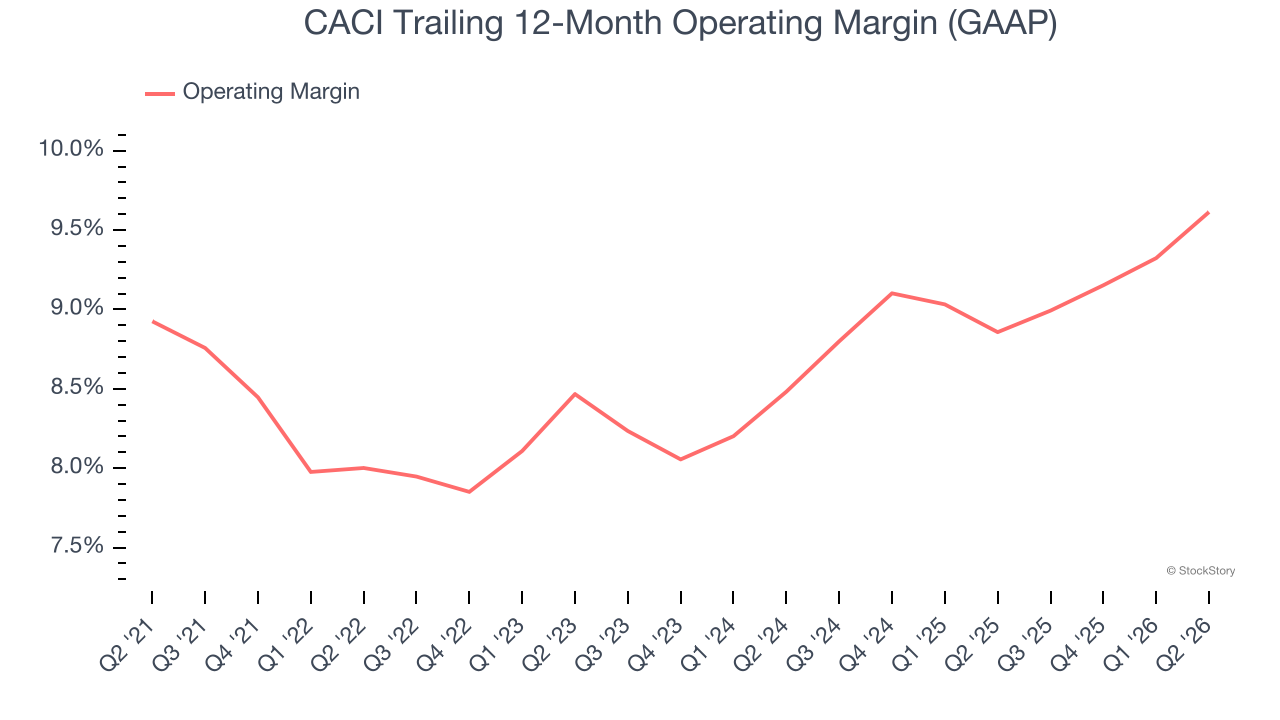
This quarter, CACI generated an operating margin profit margin of 10%, up 1.1 percentage points year on year. This increase was a welcome development and shows it was more efficient.
Earnings Per Share
Revenue trends explain a company’s historical growth, but the long-term change in earnings per share (EPS) points to the profitability of that growth — for example, a company could inflate its sales through excessive spending on advertising and promotions.
CACI’s solid 10.2% annual EPS growth over the last five years aligns with its revenue performance. This tells us its incremental sales were profitable.
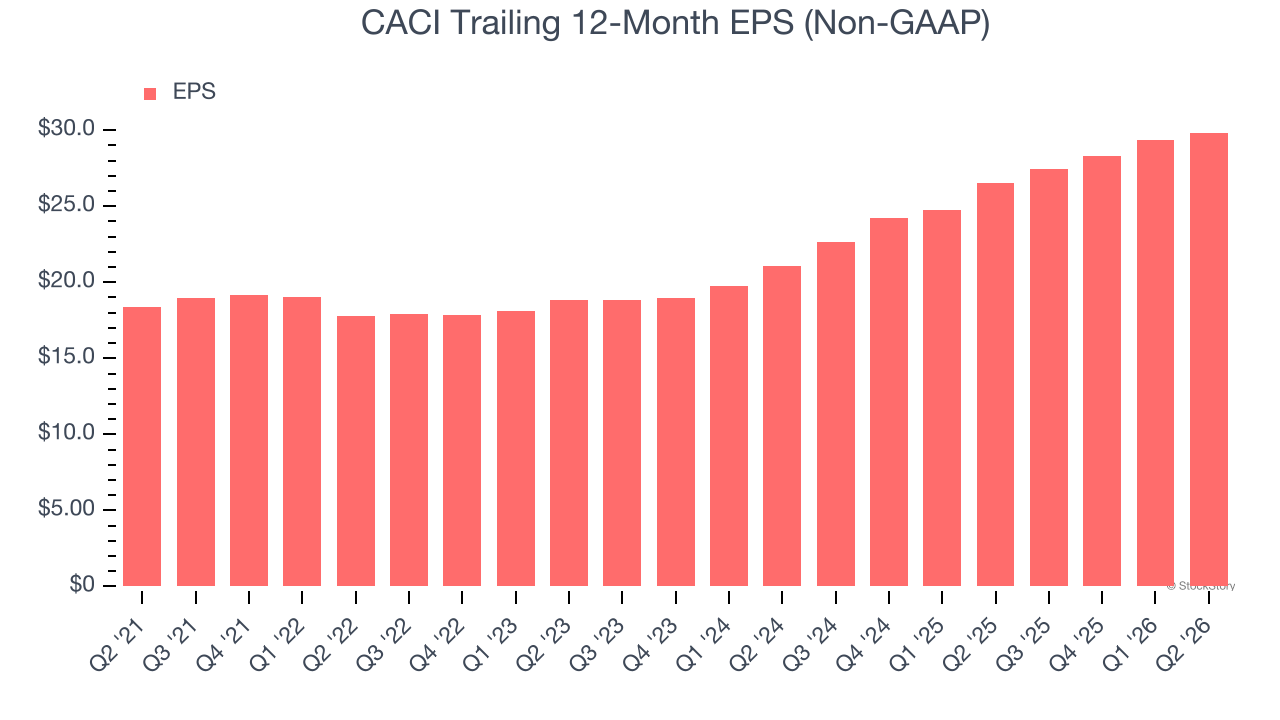
Like with revenue, we analyze EPS over a more recent period because it can provide insight into an emerging theme or development for the business.
CACI’s two-year annual EPS growth of 19% was fantastic and topped its 11.8% two-year revenue growth.
We can take a deeper look into CACI’s earnings to better understand the drivers of its performance. A two-year view shows that CACI has repurchased its stock, shrinking its share count by 1.3%. This tells us its EPS outperformed its revenue not because of increased operational efficiency but financial engineering, as buybacks boost per share earnings. 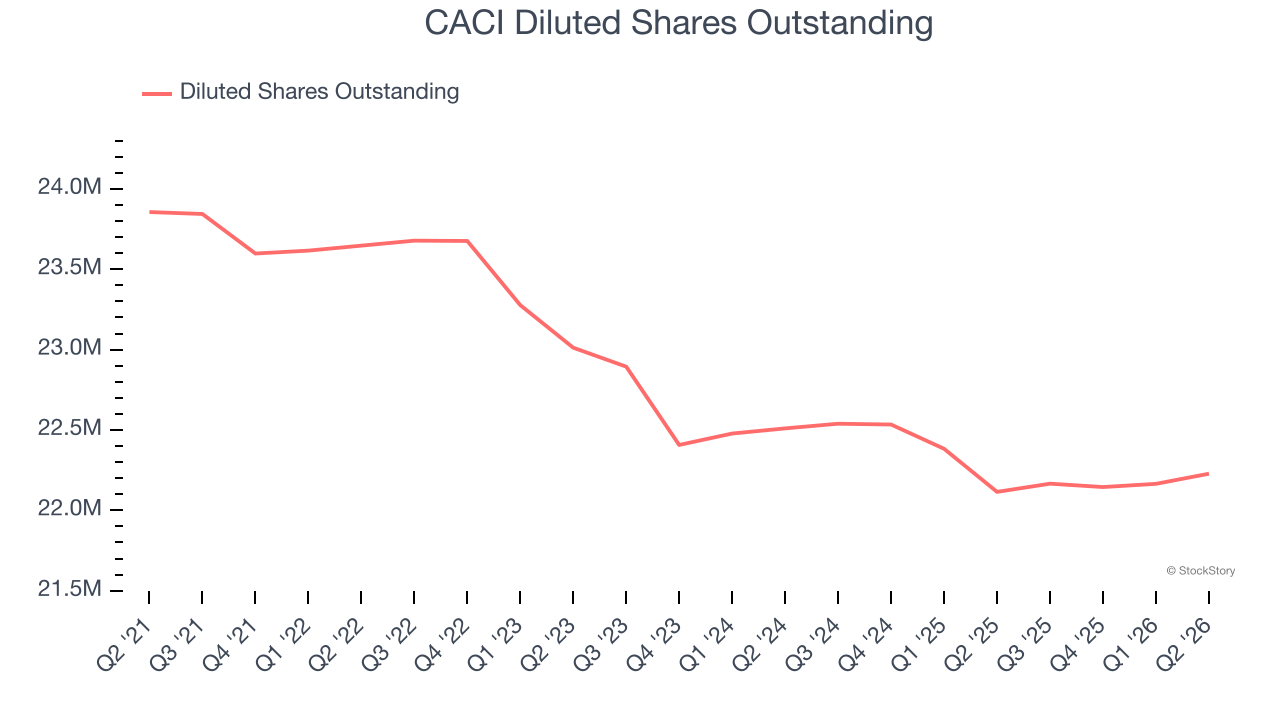
In Q2, CACI reported adjusted EPS of $8.91, up from $8.40 in the same quarter last year. This print easily cleared analysts’ estimates, and shareholders should be content with the results. Over the next 12 months, Wall Street expects CACI’s full-year EPS to grow 2.7% from $29.84 to $30.64.
Key Takeaways from CACI’s Q2 Results
We were impressed by how significantly CACI blew past analysts’ EBITDA expectations this quarter. We were also glad its full-year EPS guidance trumped Wall Street’s estimates. Zooming out, we think this was a solid print. The stock remained flat at $522.63 immediately after reporting.
CACI had an encouraging quarter, but one earnings result doesn’t necessarily make the stock a buy. Let’s see if this is a good investment. When making that decision, it’s important to consider its valuation, business qualities, as well as what has happened in the latest quarter. We cover that in our actionable full research report which you can read here (it’s free).