Senior living provider The Pennant Group (NASDAQ: PNTG) reported Q3 2026 results beating Wall Street’s revenue expectations, with revenue up 32.9% year on year to $302.3 million. Its non-GAAP profit of $0.35 per share was in line with analysts’ consensus estimates.
For more on The Pennant Group, read our free full research report.
The Pennant Group (PNTG) Q3 2026 highlights:
- Revenue $302.3 million vs S&P analysts’ consensus estimates of $299.3 million (32.9% year-on-year growth, 1% beat)
- Adjusted EPS $0.35 vs S&P analysts’ consensus estimates of $0.35 (in line)
- Adjusted EBITDA $24.71 million vs analysts’ consensus estimates of $24.58 million (8.2% margin, in line)
- Operating margin 5.5%, in line with the same quarter last year
- Market capitalization $1.44 billion
“Pennant delivered a solid quarter and strong year-over-year improvement across the organization,” said Brent Guerisoli, the Company’s Chief Executive Officer. “Our third quarter results are consistent with our full-year guidance and put us on track for a successful conclusion to the year. We continue to drive forward on our five key initiatives: leadership development, clinical excellence, margin, growth and employee experience. Our multi-year emphasis on developing great leaders has positioned us well to unlock significant upside across our portfolio.”
Revenue growth
A company’s long-term revenue performance is one signal of its overall quality. Any business can experience short-term success, but top-performing ones sustain growth for years. Over the last five years, The Pennant Group grew its revenue at a strong 22.8% compounded annual growth rate. Its growth beat the average healthcare company and shows its offerings resonate with customers.
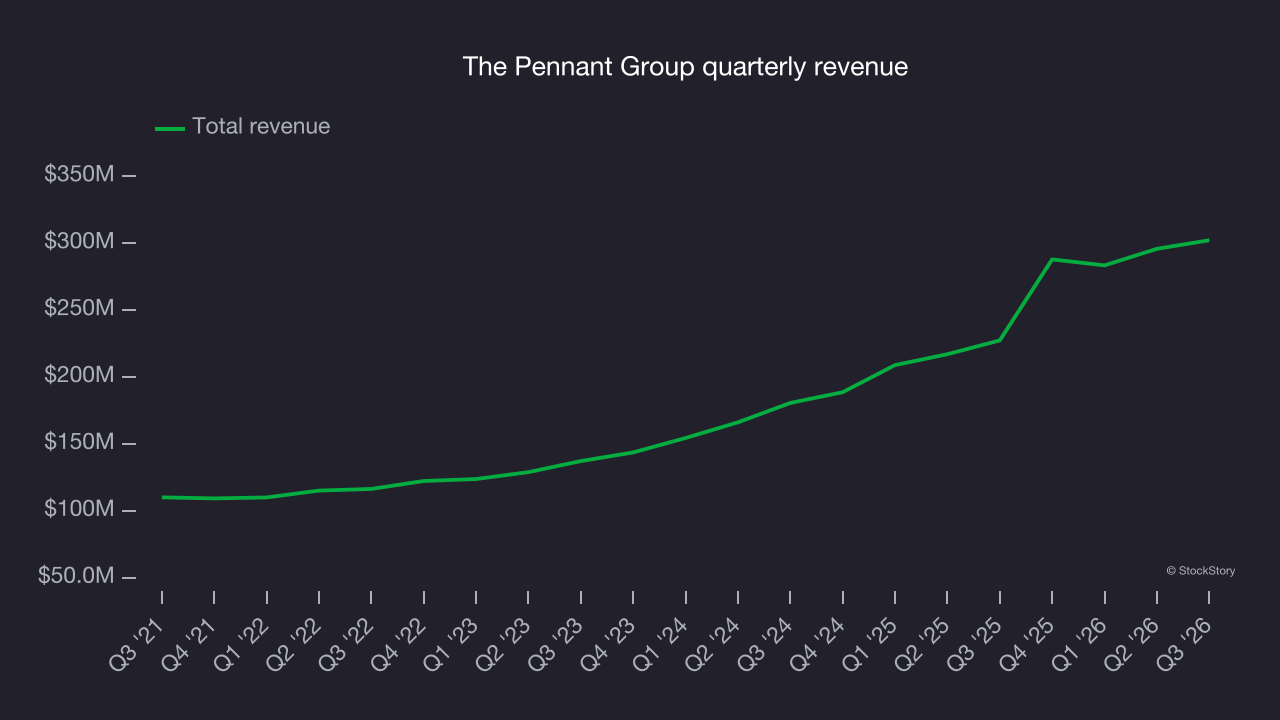
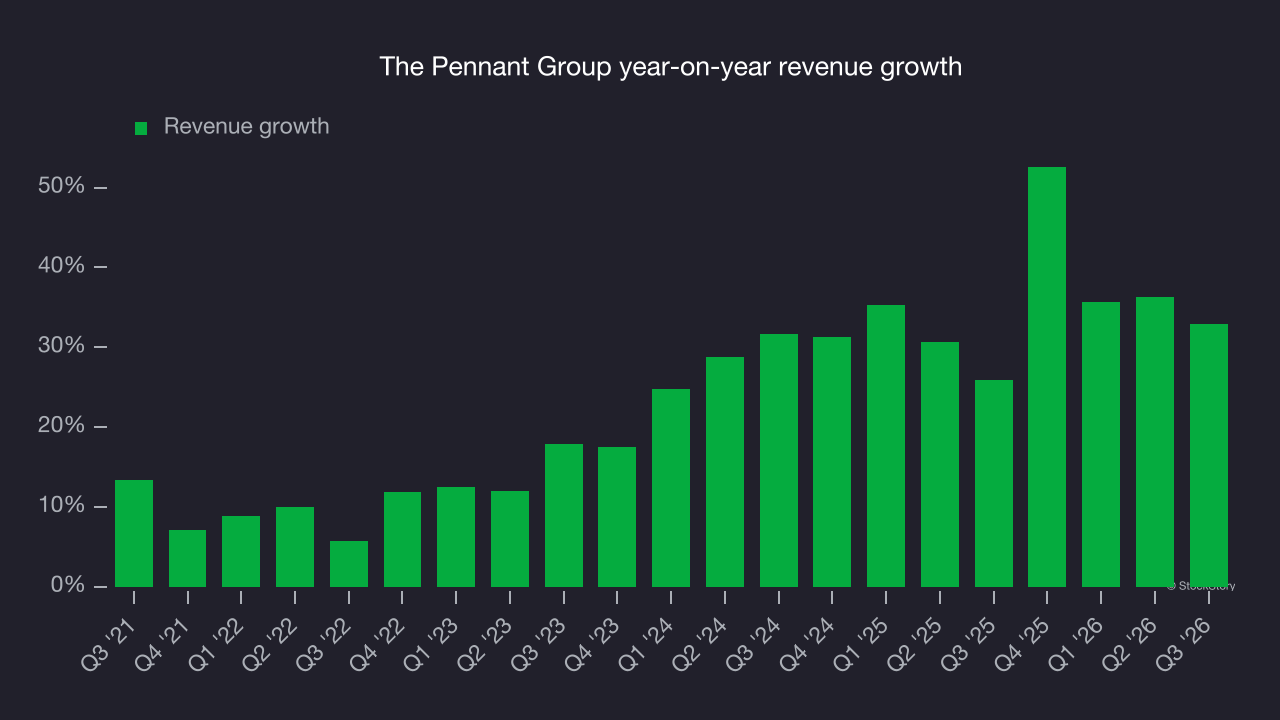
Long-term growth matters most, but within healthcare, a half-decade historical view may miss recent innovations or disruptive industry trends. The Pennant Group’s annualized revenue growth of 34.6% over the last two years is above its five-year trend, suggesting demand was strong and recently accelerated.
Admissions provide further insight into the company’s revenue dynamics and reached 28,479 in the latest quarter. Over the last two years, The Pennant Group’s admissions averaged 37.5% year-on-year growth. Admissions growth outpaced revenue growth, indicating that the company’s average selling price decreased.
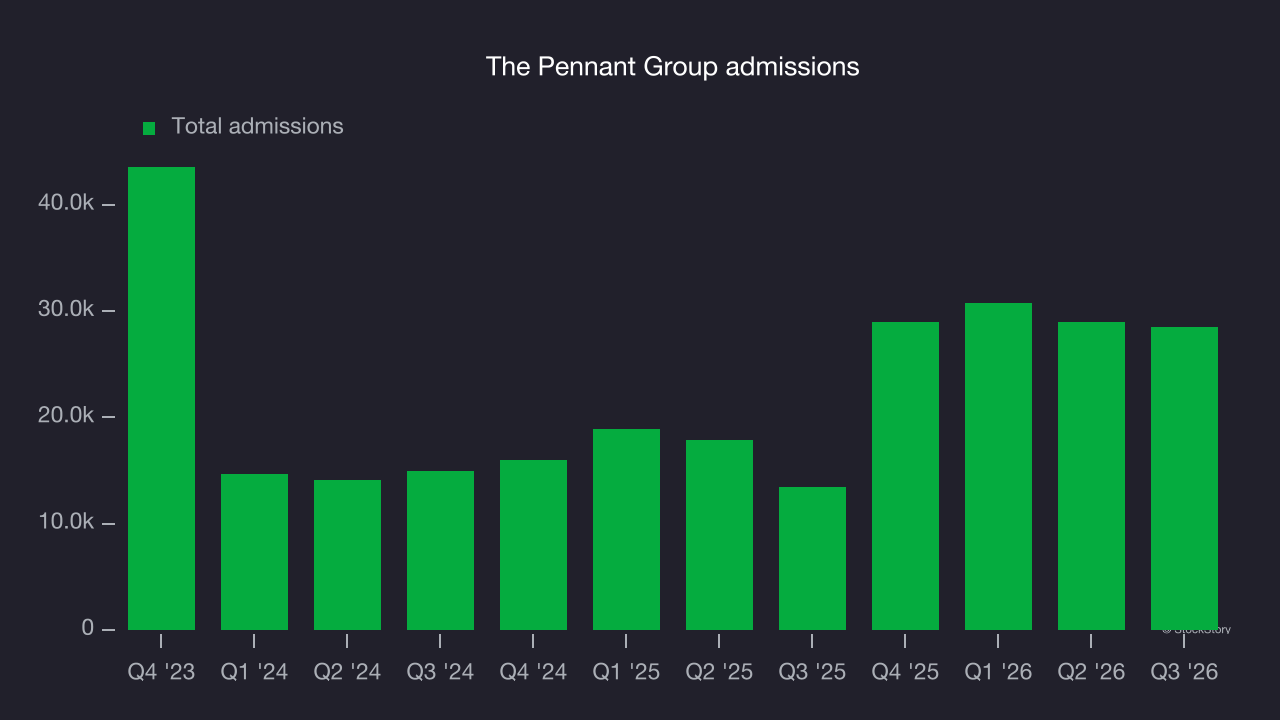
This quarter, The Pennant Group reported strong year-on-year revenue growth of 32.9%, and its $302.3 million of revenue exceeded Wall Street’s consensus estimates by 1%.
Looking ahead, sell-side analysts expect revenue to grow 7.3% over the next 12 months, according to S&P, a deceleration versus the last two years. Despite the slowdown, this projection is above average for the sector and indicates the market is factoring in some success for its newer products and services.
Adjusted operating margin
The Pennant Group was profitable over the last five years but held back by its large cost base. Its average adjusted operating margin of 6.7% was weak for a healthcare business.
On the positive side, The Pennant Group’s adjusted operating margin rose by 2.2 percentage points over the last five years, as its revenue growth provided operating leverage.
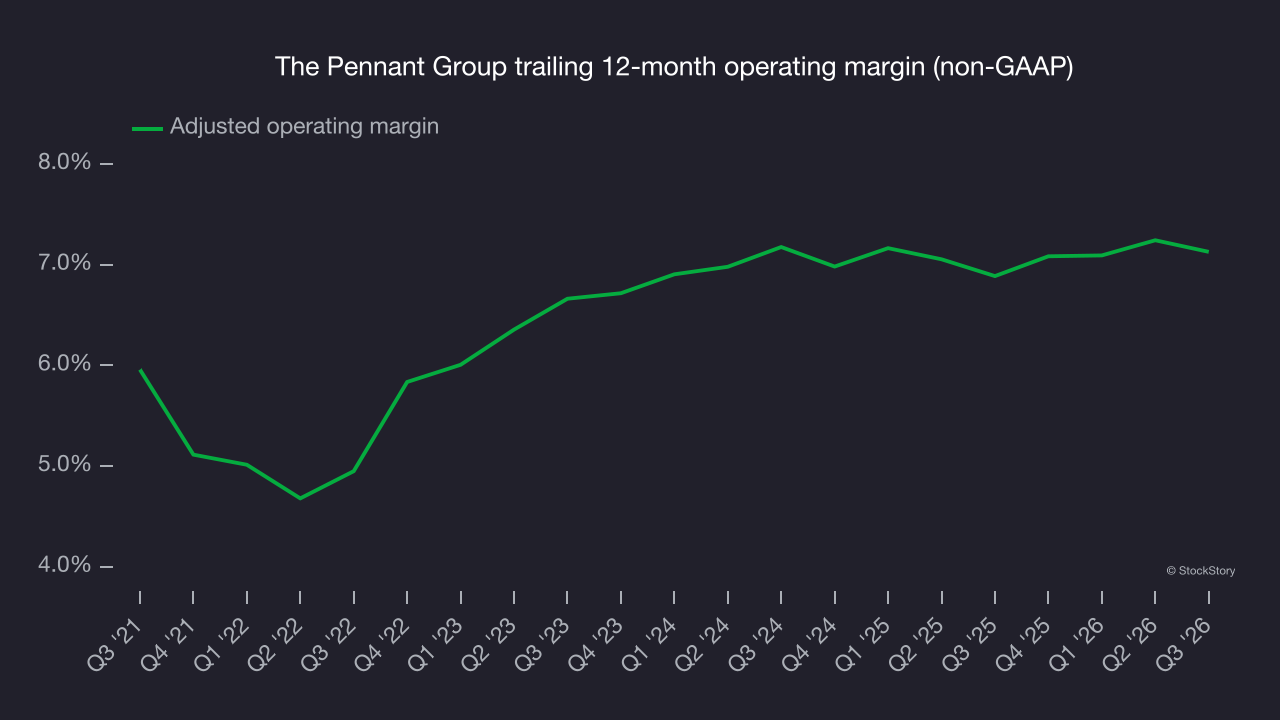
This quarter, The Pennant Group generated an adjusted operating margin of 6.6%, in line with the same quarter last year. This indicates the company’s overall cost structure has been relatively stable.
Earnings per share
Tracking long-term changes in earnings per share, or EPS, serves the same purpose as tracking long-term revenue growth. Compared to revenue, however, EPS highlights whether a company’s growth is profitable.
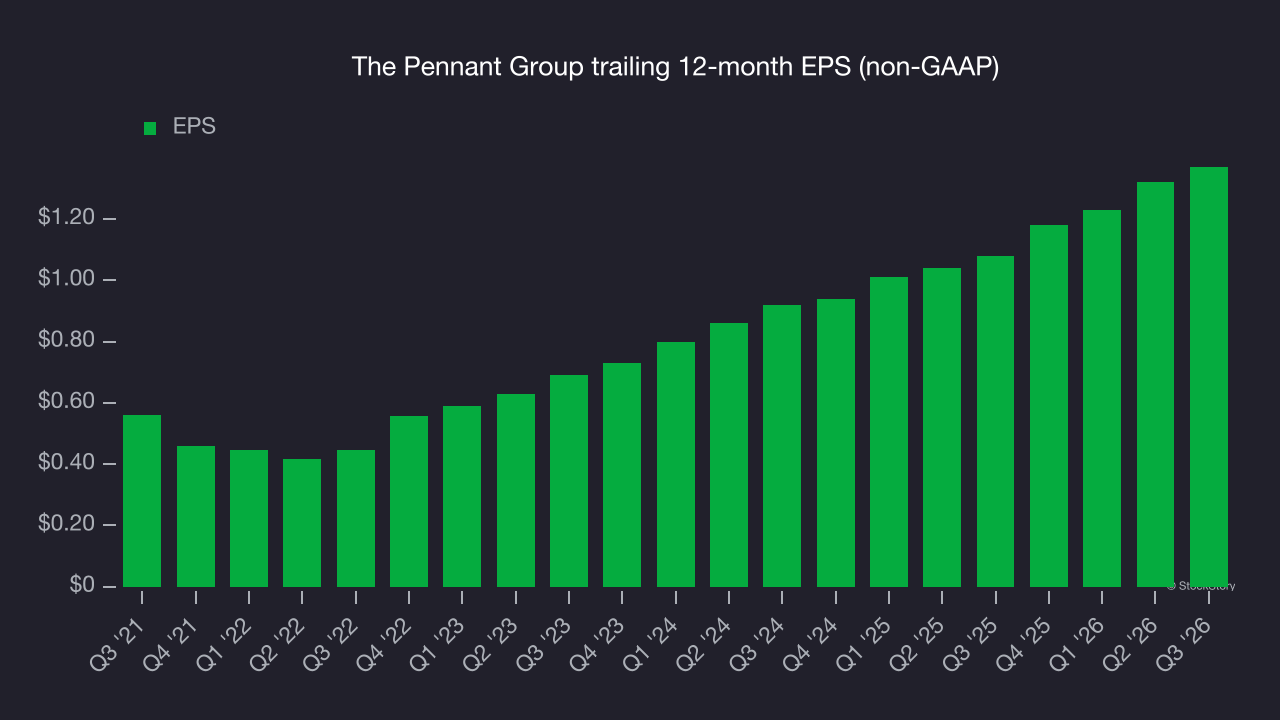
The Pennant Group’s EPS grew at a strong 19.6% compounded annual growth rate over the last five years. Despite its adjusted operating margin improvement during that time, EPS growth trailed its 22.8% annualized revenue growth, indicating that non-fundamental factors such as interest and taxes affected its ultimate earnings.
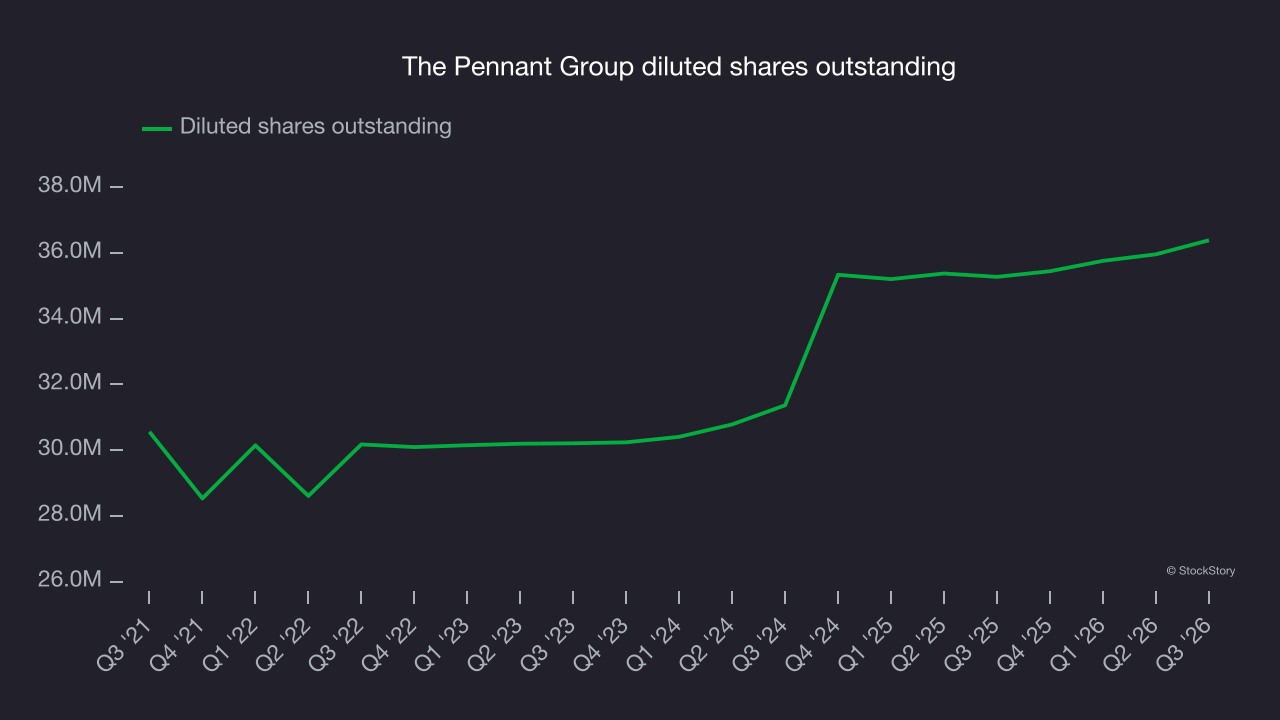
A closer look at The Pennant Group’s earnings helps explain its performance. A five-year view shows The Pennant Group has diluted its shareholders, growing its share count by 19.1%. This dilution overshadowed its increased operational efficiency and has led to lower per share earnings. Taxes and interest expenses can also affect EPS but don’t tell us as much about a company’s fundamentals.
In Q3, The Pennant Group reported adjusted EPS of $0.35, up from $0.30 in the same quarter last year. Despite growing year on year, adjusted EPS slightly missed analysts’ consensus estimates, but long-term adjusted EPS growth matters more than short-term movements. Over the next 12 months, Wall Street expects The Pennant Group’s full-year EPS to grow 11.9% from $1.37 to $1.53, according to S&P.
Key takeaways from The Pennant Group’s Q3 results
The Pennant Group’s Q3 results were mixed: Revenue narrowly topped analysts’ consensus estimates, but EPS only met expectations. The market seemed to be hoping for more, with shares falling 3.5% to $42.50 immediately after the report.
When deciding whether to buy the stock, the latest quarter matters, but not nearly as much as longer-term fundamentals and valuation. Read the full research report here (it’s free).