Global electronics contract manufacturer Kimball Solutions (NASDAQ: KE) reported revenue ahead of Wall Street’s expectations in calendar Q3 2026 (fiscal Q1 2027), with revenue up 6.9% year on year to $390.8 million. The company expects the full year’s revenue to be around $1.55 billion, close to analysts’ consensus estimates. Its non-GAAP profit of $0.25 per share was 37% below analysts’ consensus estimates.
For more on Kimball Solutions, read our free full research report.
Kimball Solutions (KE) Q3 CY2026 highlights:
- Revenue $390.8 million vs S&P analysts’ consensus estimates of $387.2 million (6.9% year-on-year growth, 0.9% beat)
- Adjusted EPS $0.25 vs S&P analysts’ consensus estimates of $0.40 (37% miss)
- Revenue guidance The company reconfirmed its revenue guidance for the full year of $1.55 billion at the midpoint
- Operating margin 3.2%, down from 4.3% in the same quarter last year
- Market capitalization $640.2 million
Revenue growth
A company’s long-term revenue performance can indicate its overall quality. Any business can post a good quarter or two, but the best consistently grow over the long term. Over the last five years, Kimball Solutions grew its revenue at a sluggish 3.1% compounded annual growth rate, falling short of the industrials sector benchmark.
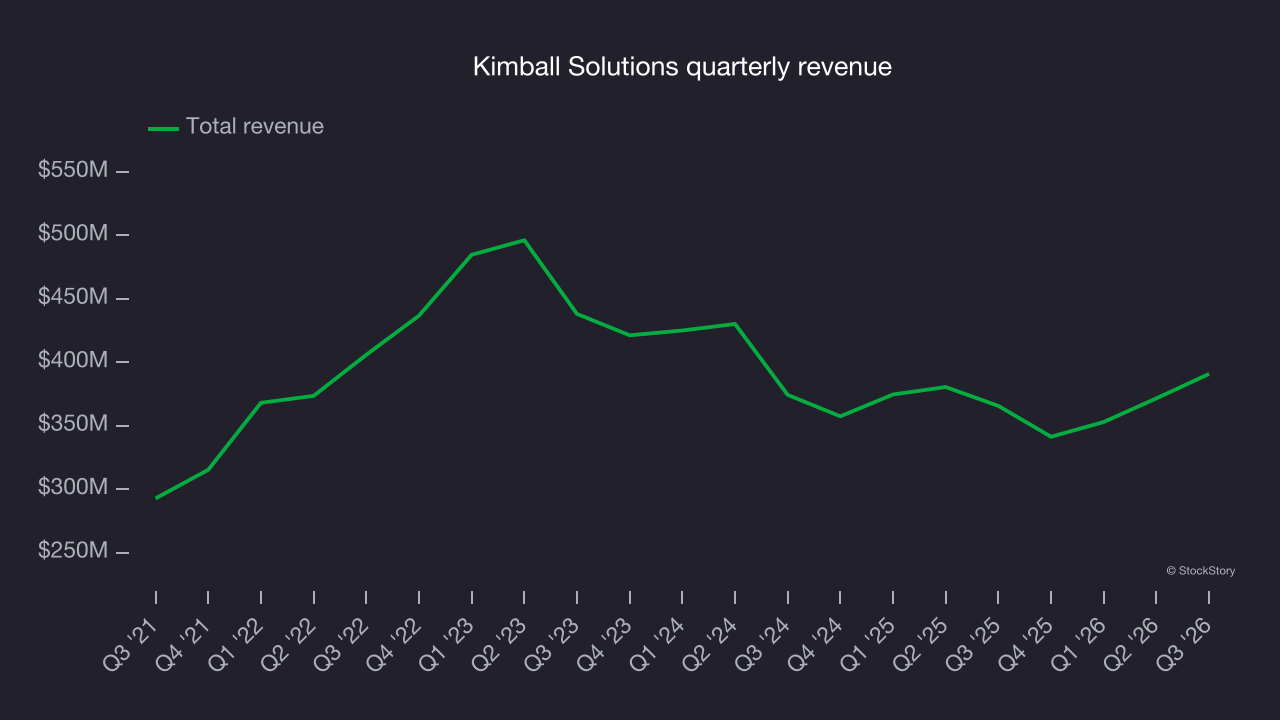
Long-term growth is the most important, but within industrials, a half-decade historical view may miss new industry trends or demand cycles. Kimball Solutions’s performance shows it grew in the past but relinquished its gains over the last two years, as its revenue fell by 6.1% annually. 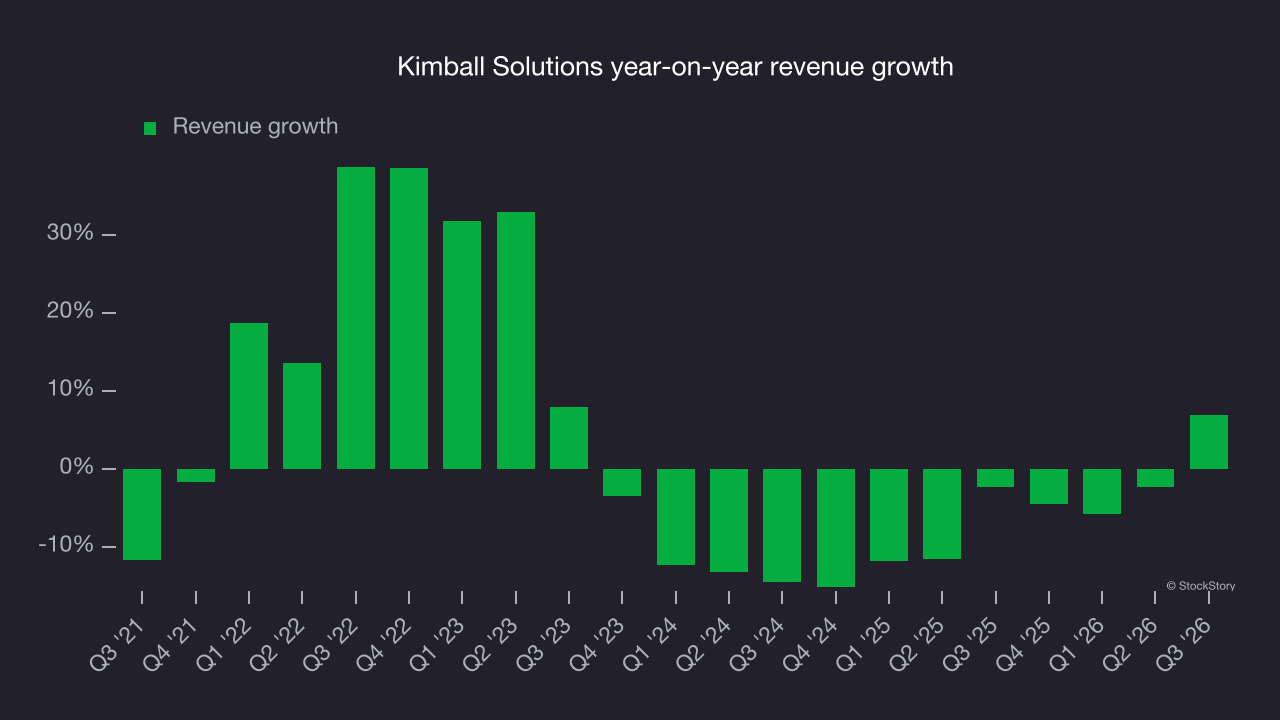
This quarter, Kimball Solutions reported year-on-year revenue growth of 6.9%, and its revenue of $390.8 million exceeded Wall Street’s consensus estimates by 0.9%.
Looking ahead, sell-side analysts expect revenue to grow 6.7% over the next 12 months, according to S&P. Although this projection suggests its newer products and services will spur better top-line performance, it is still below average for the sector.
Operating margin
Operating margin is one of the best measures of profitability because it tells us how much money a company retains after procuring and manufacturing its products, marketing and selling those products and, most importantly, keeping them relevant through research and development.
Kimball Solutions’s operating margin has more or less stayed the same over the last 12 months, averaging 4.3% over the last five years. This profitability was poor for an industrials business, reflecting its suboptimal cost structure and low gross margin.
Analyzing the trend in its profitability, Kimball Solutions’s operating margin might have fluctuated slightly but has generally stayed the same over the last five years. This raises questions about the company’s expense base because its revenue growth should have given it leverage on its fixed costs, resulting in better economies of scale and profitability.
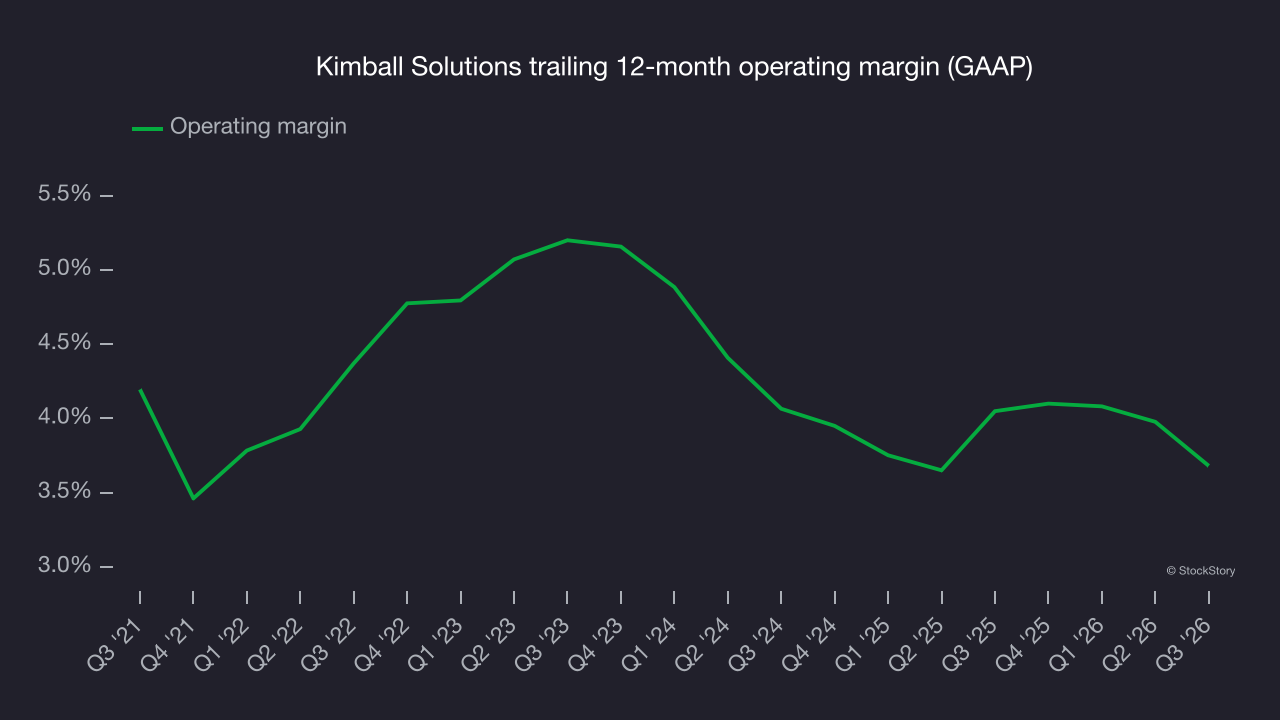
This quarter, Kimball Solutions generated an operating margin of 3.2%, down 1.1 percentage points year on year. Its operating margin declined more than its gross margin, suggesting it was less efficient because expenses such as marketing, research and development and administrative overhead increased.
Earnings per share
Revenue trends explain a company’s historical growth, but the long-term change in earnings per share (EPS) points to the profitability of that growth. For example, a company could inflate its revenue through excessive spending on advertising and promotions.
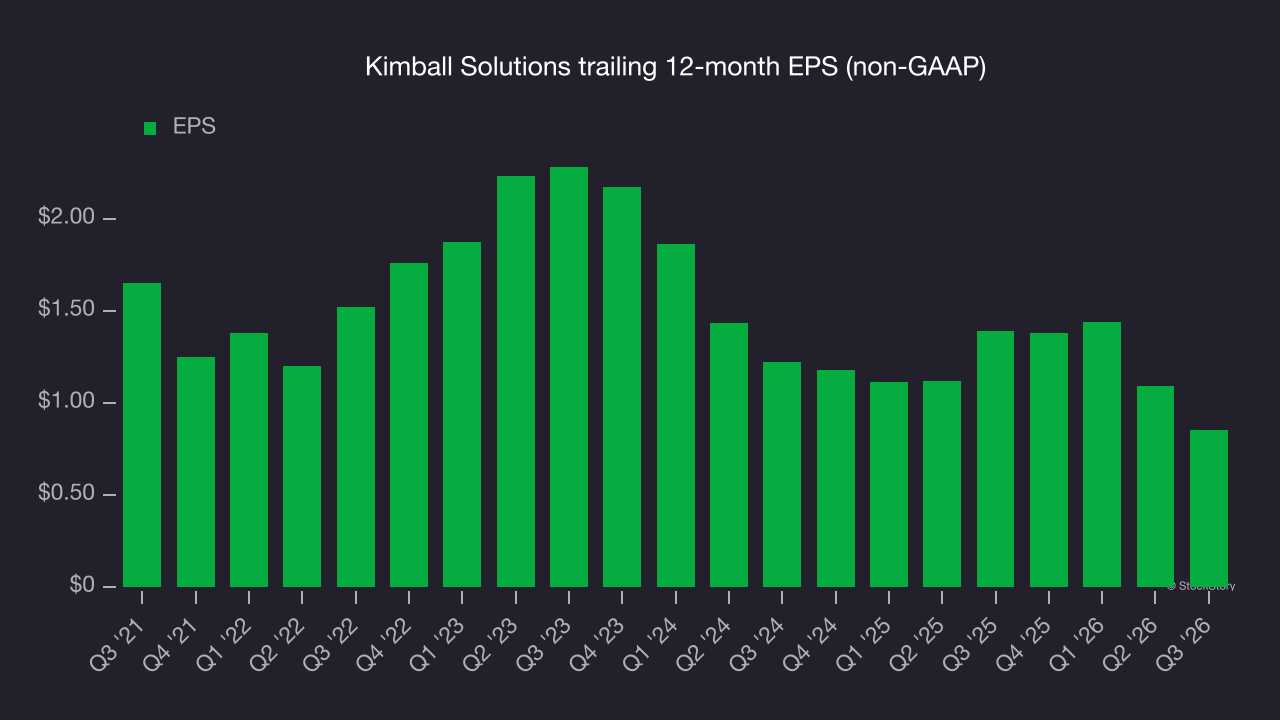
Kimball Solutions’ EPS declined by 12.4% annually over the last five years while its revenue grew by 3.1%. The difference stemmed from higher interest expenses or taxes, as the company improved its operating margin and repurchased its shares during this time.
As with revenue, analyzing EPS over a more recent period can provide insight into an emerging theme or development for the business.
For Kimball Solutions, its two-year annual EPS declines of 16.5% show it’s continued to underperform. The results were poor over both periods.
In Q3, Kimball Solutions reported adjusted EPS of $0.25, down from $0.49 in the same quarter last year. This result missed analysts’ consensus estimates. Over the next 12 months, Wall Street expects Kimball Solutions’s full-year EPS to grow 93.3% from $0.85 to $1.64, according to S&P.
Key takeaways from Kimball Solutions’s Q3 results
Kimball Solutions’ narrow revenue beat against analysts’ consensus estimates was tempered by an EPS miss, making this a weaker quarter overall. Shares tumbled 9% to $23.58 immediately after the results.
Kimball Solutions had a disappointing quarter, but that alone doesn’t determine whether the stock is a buy. The latest quarter is only one piece of the longer-term business quality picture. Quality, when combined with valuation, can help determine if the stock is a buy. For more on Kimball Solutions, read the full research report here (it’s free).