Historical Canadian options dataset includes flexible options pricing methodologies, rich historical data, and tighter implied volatilities, for quantitative professionals to gain insights on equities, indices, ETFs, market events, and risk
OptionMetrics, the leading historical options data and analytics provider for institutional investors and academic researchers worldwide, today announced IvyDB Canada 5.0, giving institutional investors, hedge funds, mutual funds, and quantitative researchers expanded high-quality historical options data and analytics on Canadian markets and more ways to leverage it. The updated database offers even greater flexibility in options data calculation methodologies, even more accurate implied volatilities, and a smoother volatility surface for backtesting and assessing risk.
This press release features multimedia. View the full release here: https://www.businesswire.com/news/home/20260617468628/en/
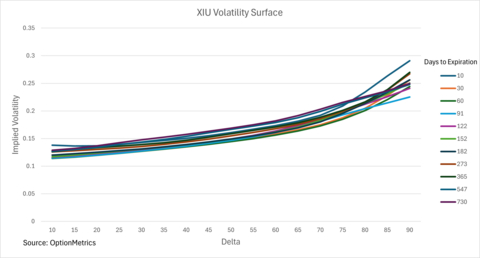
The above chart shows the volatility surface for XIU (iShares S&P/TSX 60 Index ETF), with some of the largest, most liquid companies on the Toronto Stock Exchange, by days to expiration. The above volatility surfaces, calculated with OptionMetrics IvyDB Canada 5.0, show a consistent upward slope across deltas, indicating a pronounced skew where higher-delta (in-the-money call / out-of-the-money put) options carry higher implied volatility. Volatility levels are broadly stable across maturities, with a slight increase for longer-dated options. The data from OptionMetrics can provide users with a clearer view of relative option pricing, helping to identify opportunities for hedging and volatility-based strategies. OptionMetrics IvyDB Canada 5.0 covers over 300 optionable securities (equities, indices, and ETFs) from Canadian exchanges, with historical data and daily updates available for most since March 2007.
IvyDB Canada 5.0 covers over 300 optionable securities from Canadian exchanges, with historical data and daily updates available for most since March 2007. This newest release gives users:
- Flexibility to choose to include borrow rates—the interest cost associated with holding a stock intended for short sale—or to continue to use legacy calculations that do not embed an implied borrow rate in options price methodologies, or to use both to compare/contrast.
- Ability to easily assess dividend strategies, with dividend forecasts from leading-edge Woodseer Dividend Forecast data automatically included alongside respective securities in the upgraded dataset.
- Accurate securities and implied volatility price metrics with Woodseer Dividend Forecast data now also used in IvyDB Canada 5.0 calculations.
Trading in Canadian options is on the rise, with The Montreal Exchange reporting an average of 950,000 Canadian derivatives contracts traded daily in Q4 2025 (a 10% increase year-over-year), including increases in ETF options volume and equity options volume.
“With the proliferation of short-dated options, high-beta CDRs, hedging, and speed in trading, the Canadian options market is steadily growing,” said Eran Steinberg, COO at OptionMetrics. “As the premier provider of historical options data, analytics, and volatility worldwide, we are committed to giving institutional investors and academics access to the highest quality data, with which to capture information to assess risk and develop investment strategies. Many of our clients tell us our data is indispensable, as OptionMetrics continues to make precise valuations and flexibility a priority in our datasets.”
OptionMetrics announced similar methodology updates in its flagship IvyDB US 7.0 and IvyDB ETF 5.0 historical options data earlier this year. The new updates in IvyDB Canada 5.0 enable quants and others to easily convert and build strategies developed in IvyDB US to IvyDB Canada.
IvyDB Canada includes daily option pricing information, dividend projections, historical distributions and corporate actions, such as splits, mergers, and name changes. OptionMetrics calculates implied volatility for each option price and stores it along with option sensitivities. A standardized constant-maturity volatility surface is calculated for each security every day, enabling users to create robust volatility trading strategies. Daily updates are provided via FTP, Snowflake, and/or OptionMetrics’ Genie loader, enhanced for easier loading.
Contact OptionMetrics to learn more.
View source version on businesswire.com: https://www.businesswire.com/news/home/20260617468628/en/
“With the proliferation of short-dated options, high-beta CDRs, hedging, and speed in trading, the Canadian options market is steadily growing,” said Eran Steinberg, COO at OptionMetrics.
Contacts
Media Contact:
Hilary McCarthy
774.364.1440
Hilary@clearpointagency.com