

Tesla Inc. (TSLA) is conducting a recall of 1.6 million vehicles in China with the aim of rectifying issues emanating from its Autopilot driver assistance system and mitigating the potential for collisions. This comes on the heels of two similar recalls actioned by Tesla in the United States last month. The automaker embarked on a mass-scale recall, exceeding 2 million vehicles, to insert new protective measures into its Autopilot advanced driver-assistance system in accordance with safety concerns raised by federal regulators.
TSLA’s most recent quarter saw Tesla's market control drop to 50%, a significant decrease from the 62% grip it held during the first quarter. In spite of instigating a price battle to bolster its position amidst fierce competition within the electric vehicle segment, several other auto manufacturers have resorted to drastic price reductions to fight against the challenging demand landscape brought on by rampant inflation and escalating lending costs.
In November 2023, HSBC Global initiated coverage with a “reduce” rating and a $146 price target. On the bearish side, HSBC analysts wrote, “Significant delays or developments that show lack of technological and/or regulatory feasibility for a commercial launch of these projects pose a significant risk for Tesla.”
Furthermore, TSLA finds itself under mounting pressure due to an expanding worker strike in Sweden coupled with labor stress in the United States.
In addition, considering its elevated valuation, alternative players within the industry may prove to be more prudent investments when anticipating the technology surge in 2024. Analyzing some of its key performance indicators could offer meaningful insights.
Examining Tesla Inc's Financial Trends from 2021 to 2023
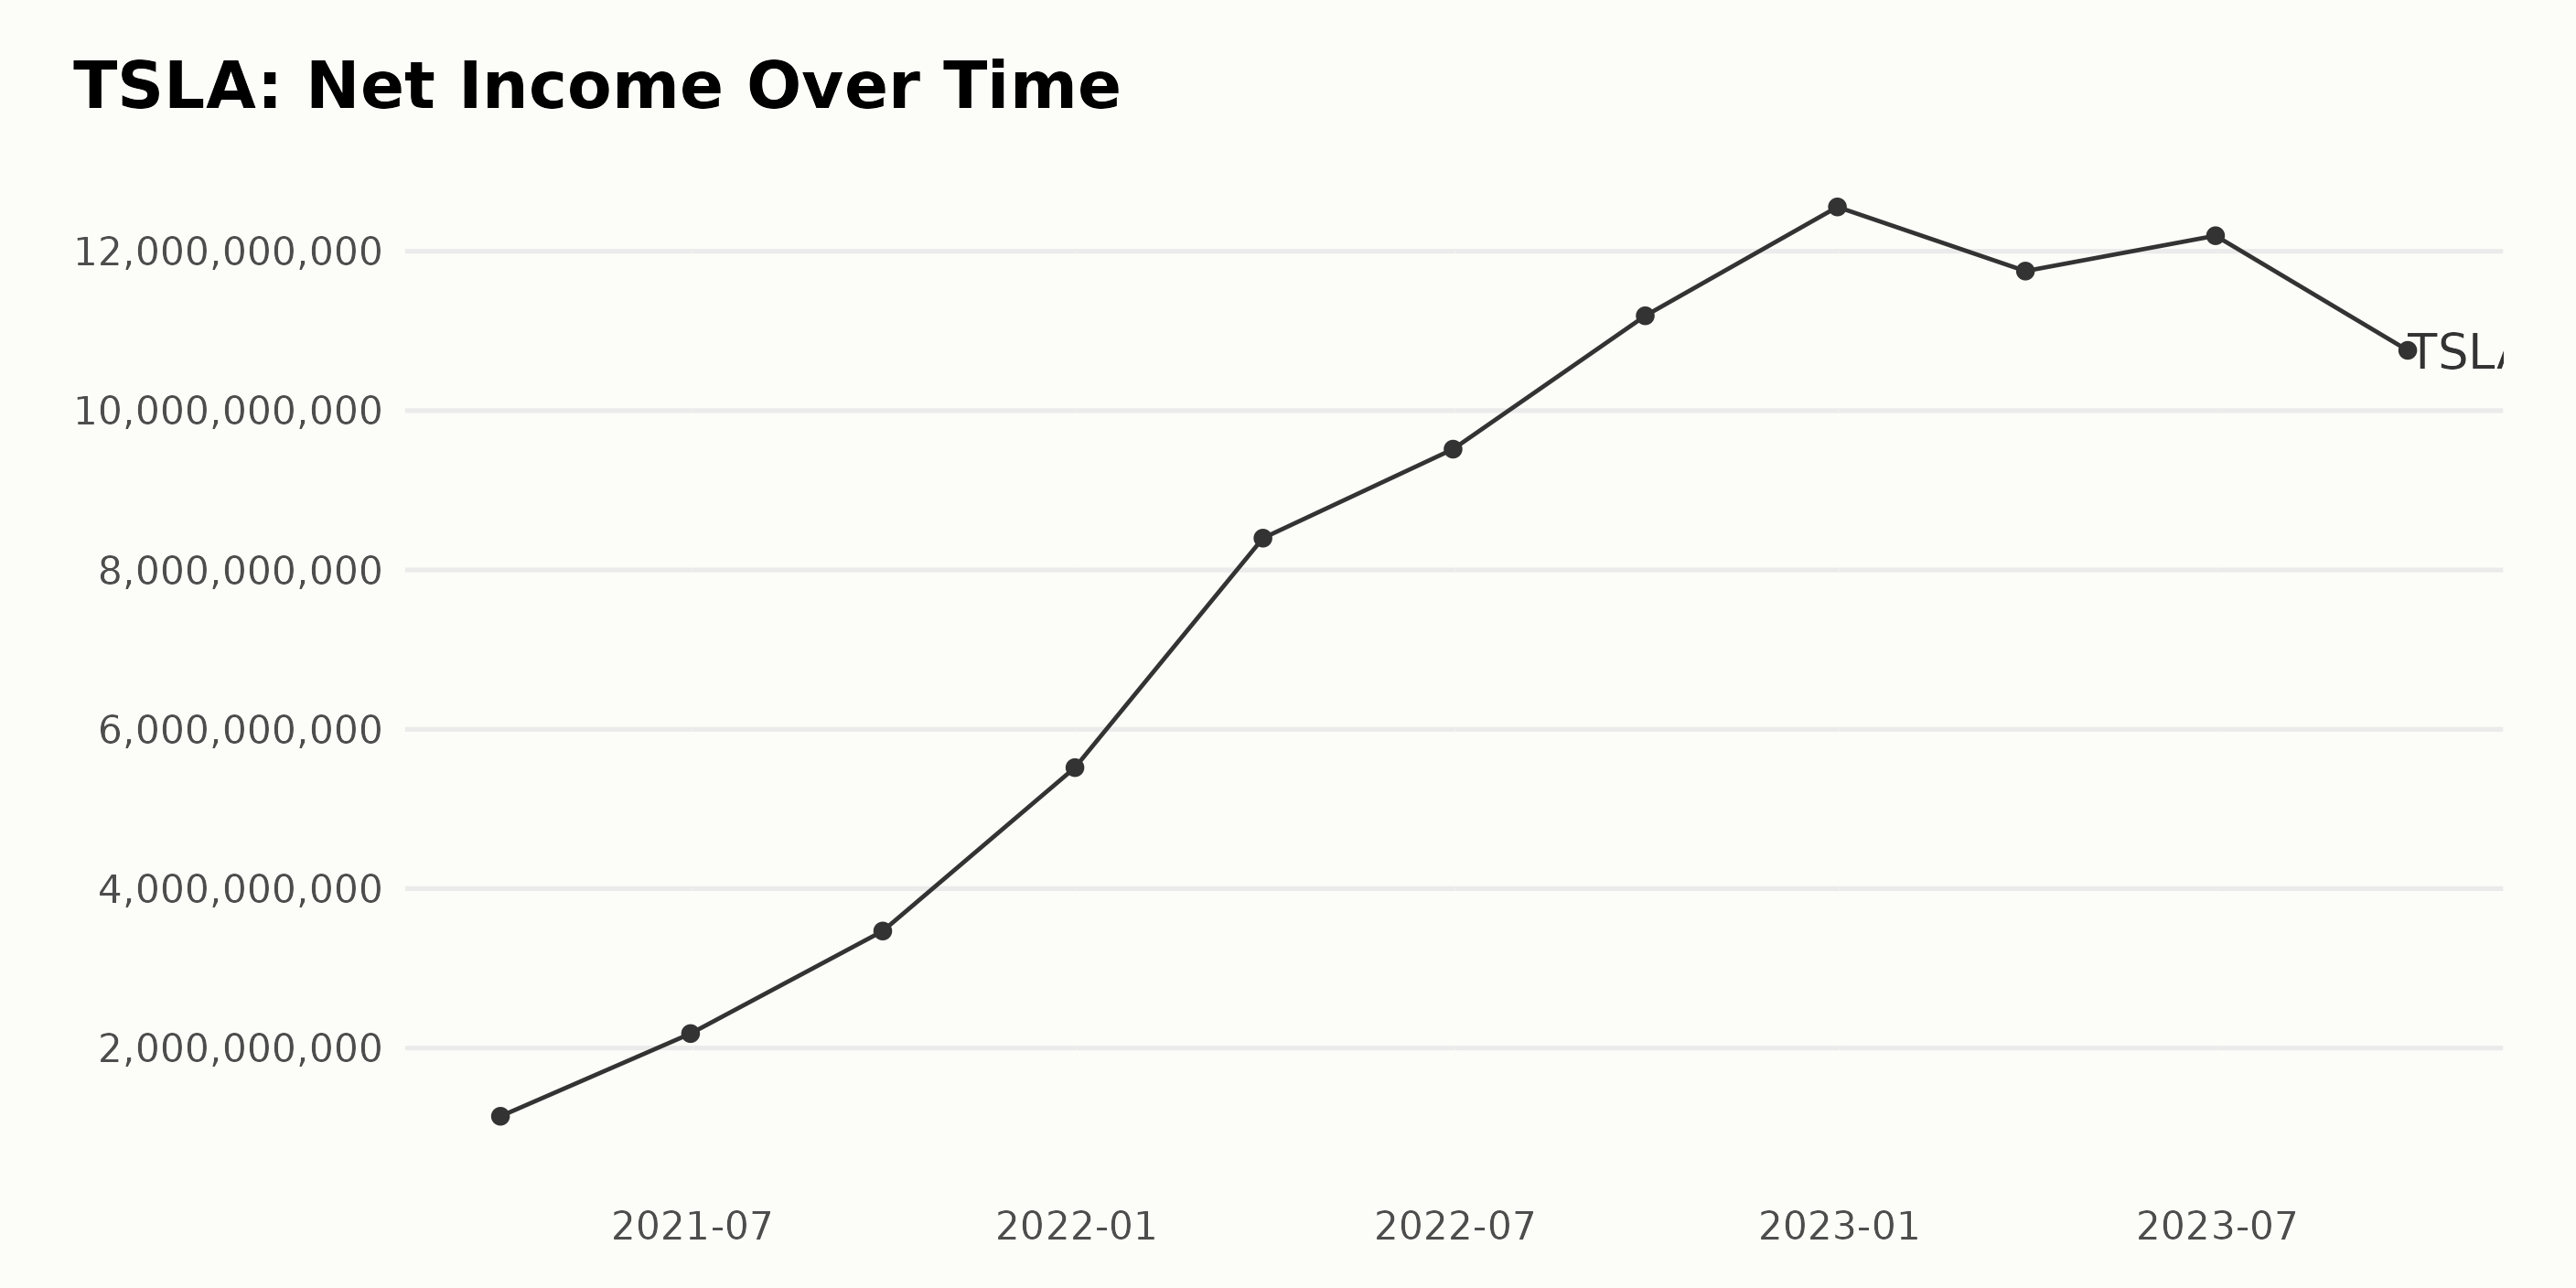
In analyzing the trailing-12-month net income of TSLA, there is a clear trend of an overall increase, albeit with slight fluctuations, from March 2021 to September 2023 based on the provided data. Noteworthy changes are as follows:
- From March 2021 to December 2022, TSLA's Net Income consistently grew from $1.14 billion to $12.56 billion.
- The Net Income experienced a small drop in the first quarter of 2023 to $11.75 billion but again picked up in June 2023 reaching a peak at $12.19 billion.
- As of the final entry in the series, September 2023, there is a noticeable dip in the Net Income to $10.76 billion.
The growth rate, measuring the first value against the last value in the series, indicates an overall substantial increase, demonstrating an approximately 842% rise ($1.14 billion to $10.76 billion). Despite minor fluctuations, this data represents a dramatic upward trend in Tesla's Net Income over the span of two and a half years. This trend, particularly the most recent decrease in Net Income, should be a crucial focal point moving forward. Further data and analysis would be needed to predict whether this represents a temporary setback or a shift in Tesla Inc.'s financial health.
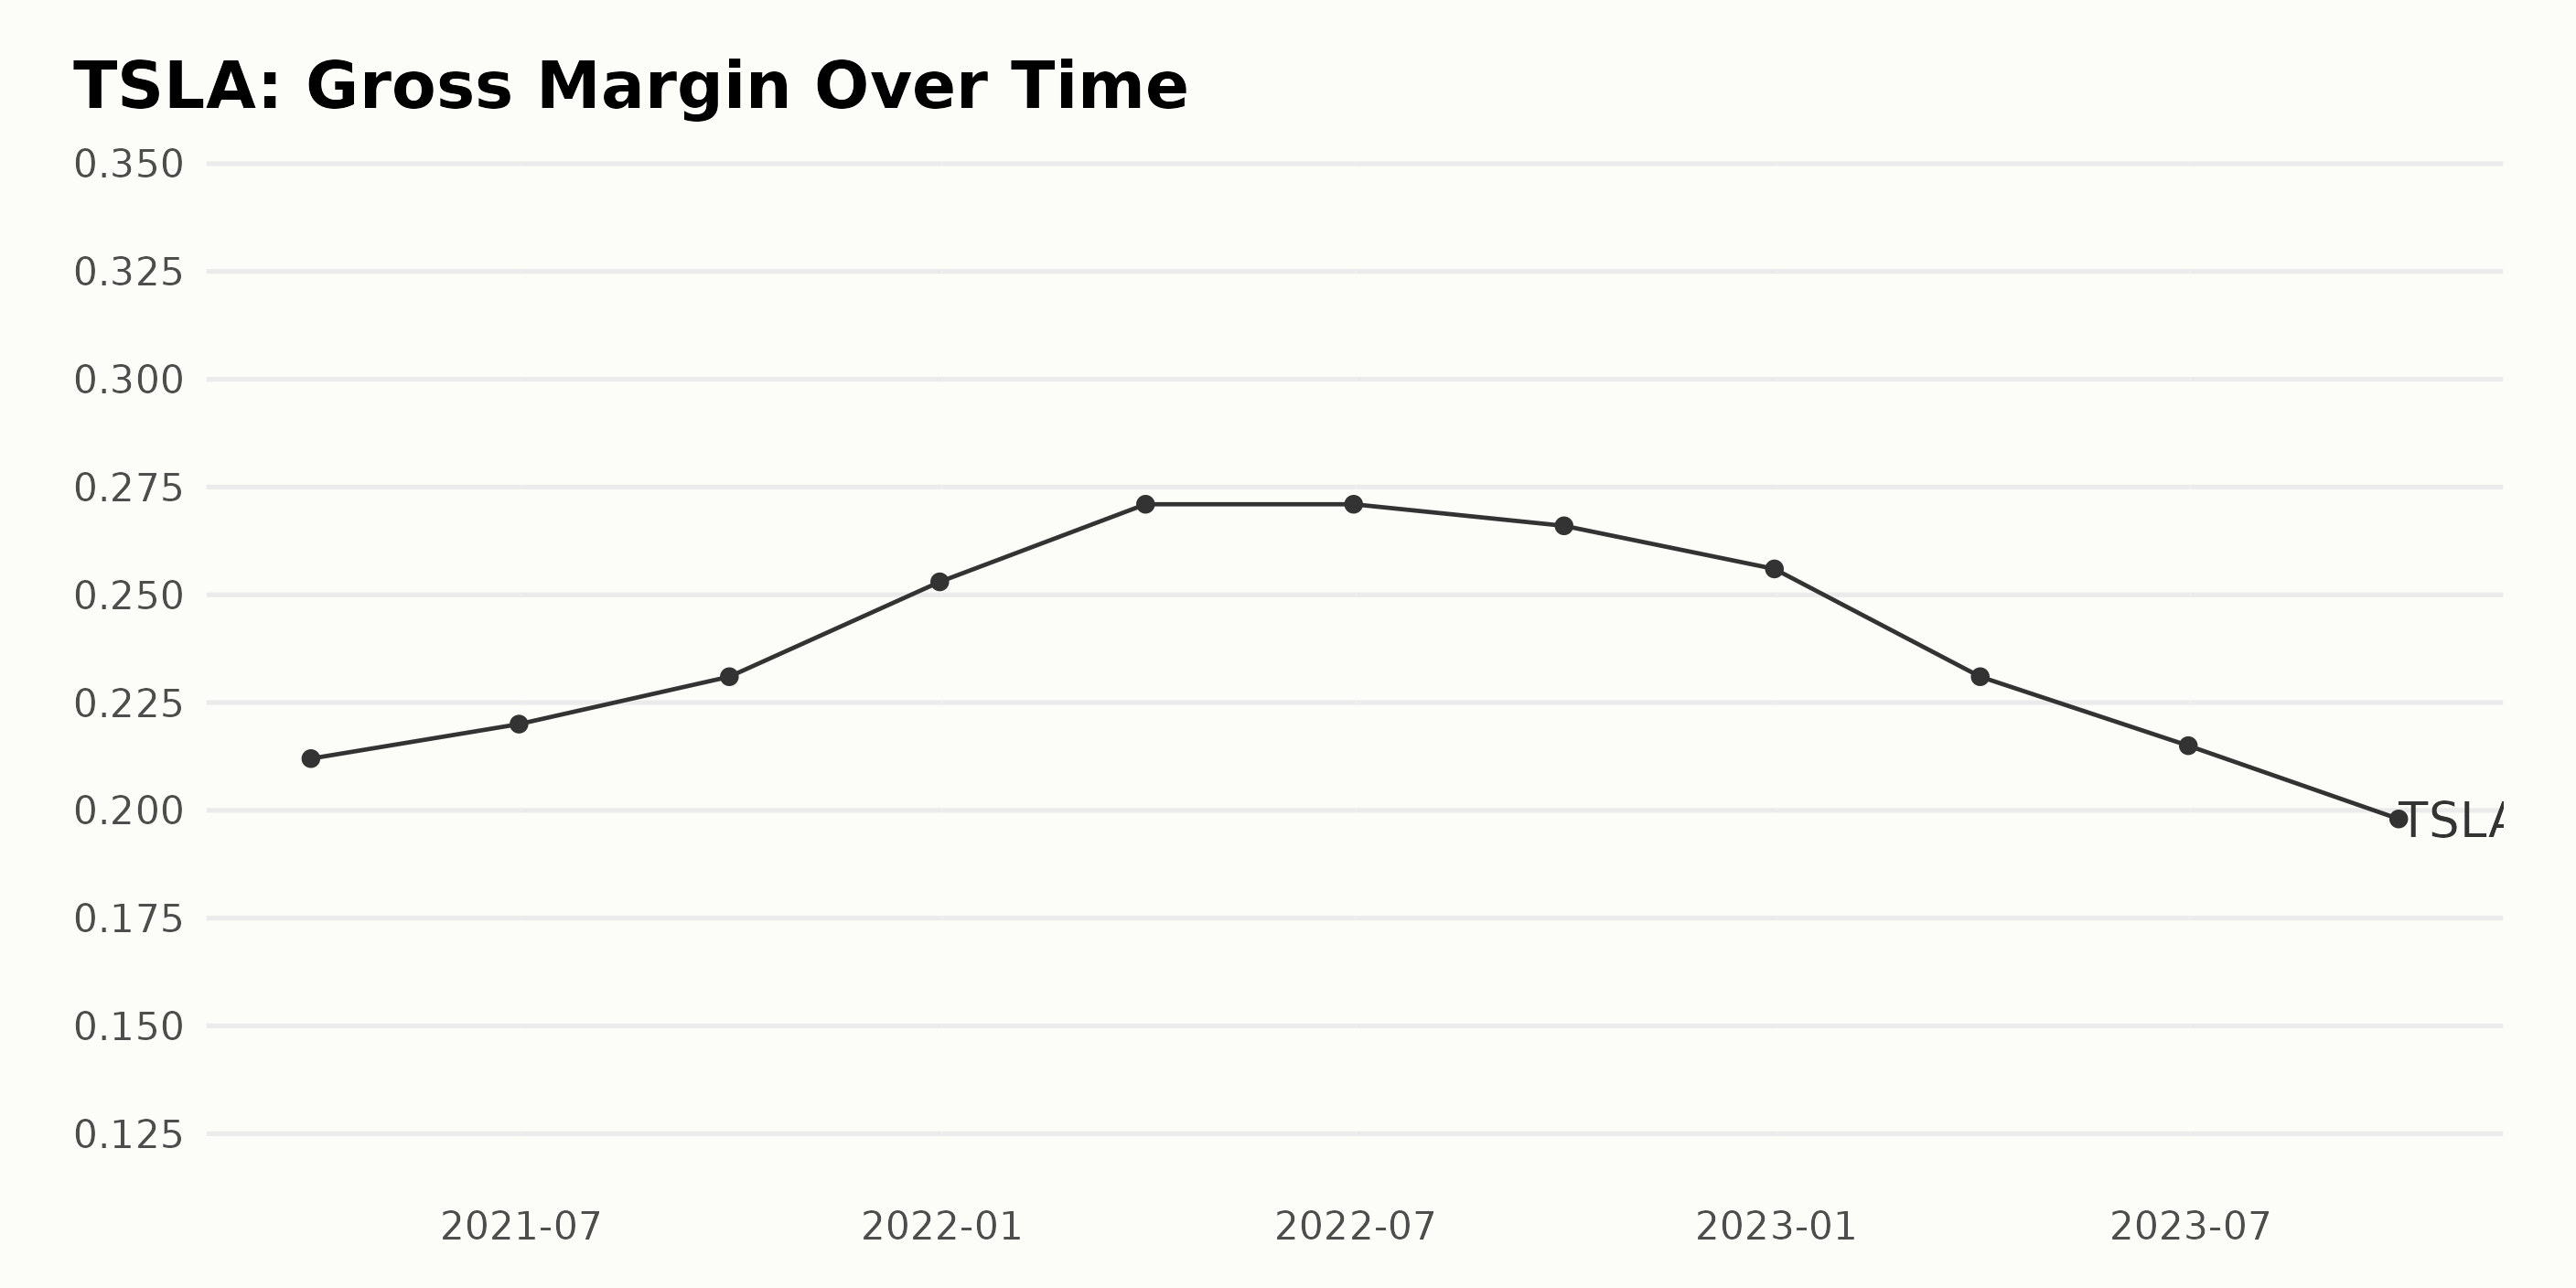
The Gross Margin trend of TSLA over the observed period shows a general growth with some fluctuations.
- Starting at 21.2% by the end of the first quarter, 2021, Gross Margin increased relatively steady reaching a peak at the end of second quarter, 2022, where it stood at 27.1%.
- From that point, the data shows a gradual downward trend, with third quarter, 2022 and fourth quarter, 2022 reporting 26.6% and 25.6% respectively.
- The trend further declines into 2023 where Gross Margin decreases to 23.1% in the first quarter, 21.5% in second, and then to 19.8% by the end of third quarter.
Overall, the reported Gross Margin shows a growth rate of -2.4% from the first quarter, 2021 to third quarter, 2023. Despite the fluctuations, it's important to note the considerable growth witnessed up until mid 2022 before the downward trend.
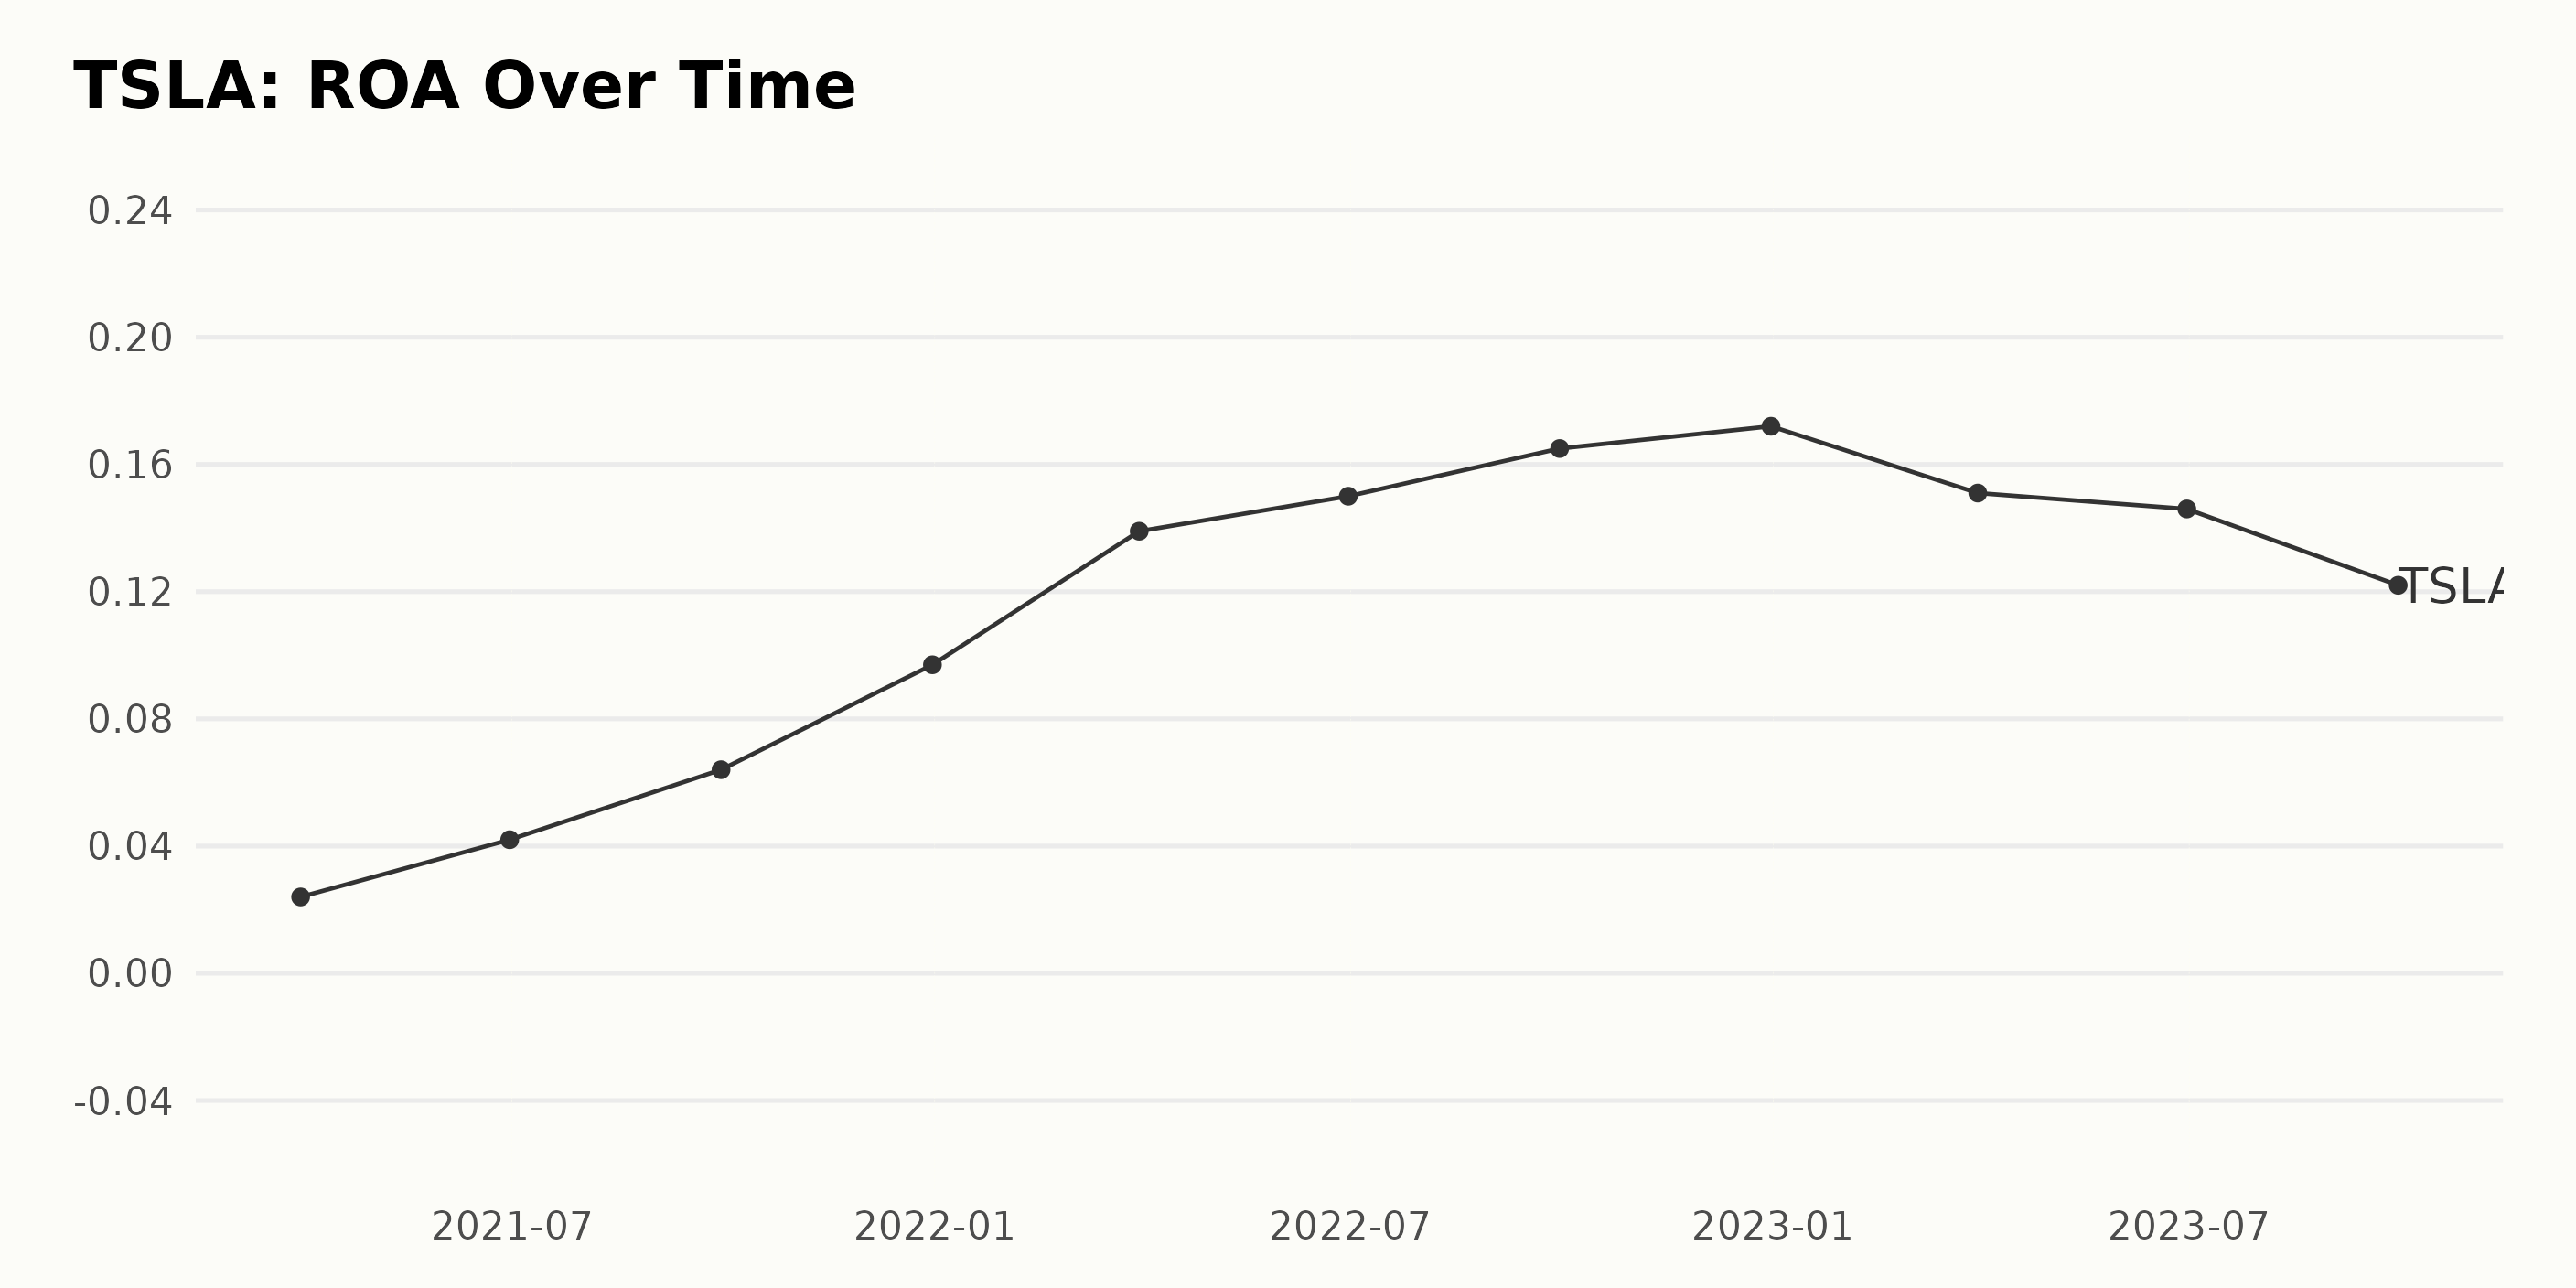
The Return on Assets (ROA) of TSLA has displayed a fluctuating trend with overall growth in recent years based on the provided series of data. Below provides a more detailed view:
- On March 31, 2021, the ROA was 2.4%.
- By June 30, 2021, there was an increase to 4.2%.
- The ROA continued its upward launch reaching 6.4% by September 30, 2021.
- By the close of 2021, on December 31, it hit a high of 9.7%.
- In 2022, the first quarter reported an increased ROA of 13.9%, followed by a minimal rise to 15.0% in the second quarter.
- Reaching a peak of 16.5% in the third quarter of 2022, it closed the year at 17.2% on December 31.
However, the following year saw a reverse in this growing trend:
- By March 31, 2023, the ROA reduced to 15.1%.
- A further fall was reported in the second quarter, with the ROA down to 14.6% as of June 30, 2023.
- Finally, by September 30, 2023, the latest data point, the ROA further dropped to 12.2%.
In summary, the ROA of Tesla Inc. showed an ascending trend from March 2021 to December 2022, climbing from 2.4% to a peak of 17.2%, suggesting an increase of approximately 617%. However, the trend reversed in 2023 with a consistent drop in the ROA down to 12.2% as of the end of September 2023. This current stance represents an approximately 408% growth from the initial value in March 2021.
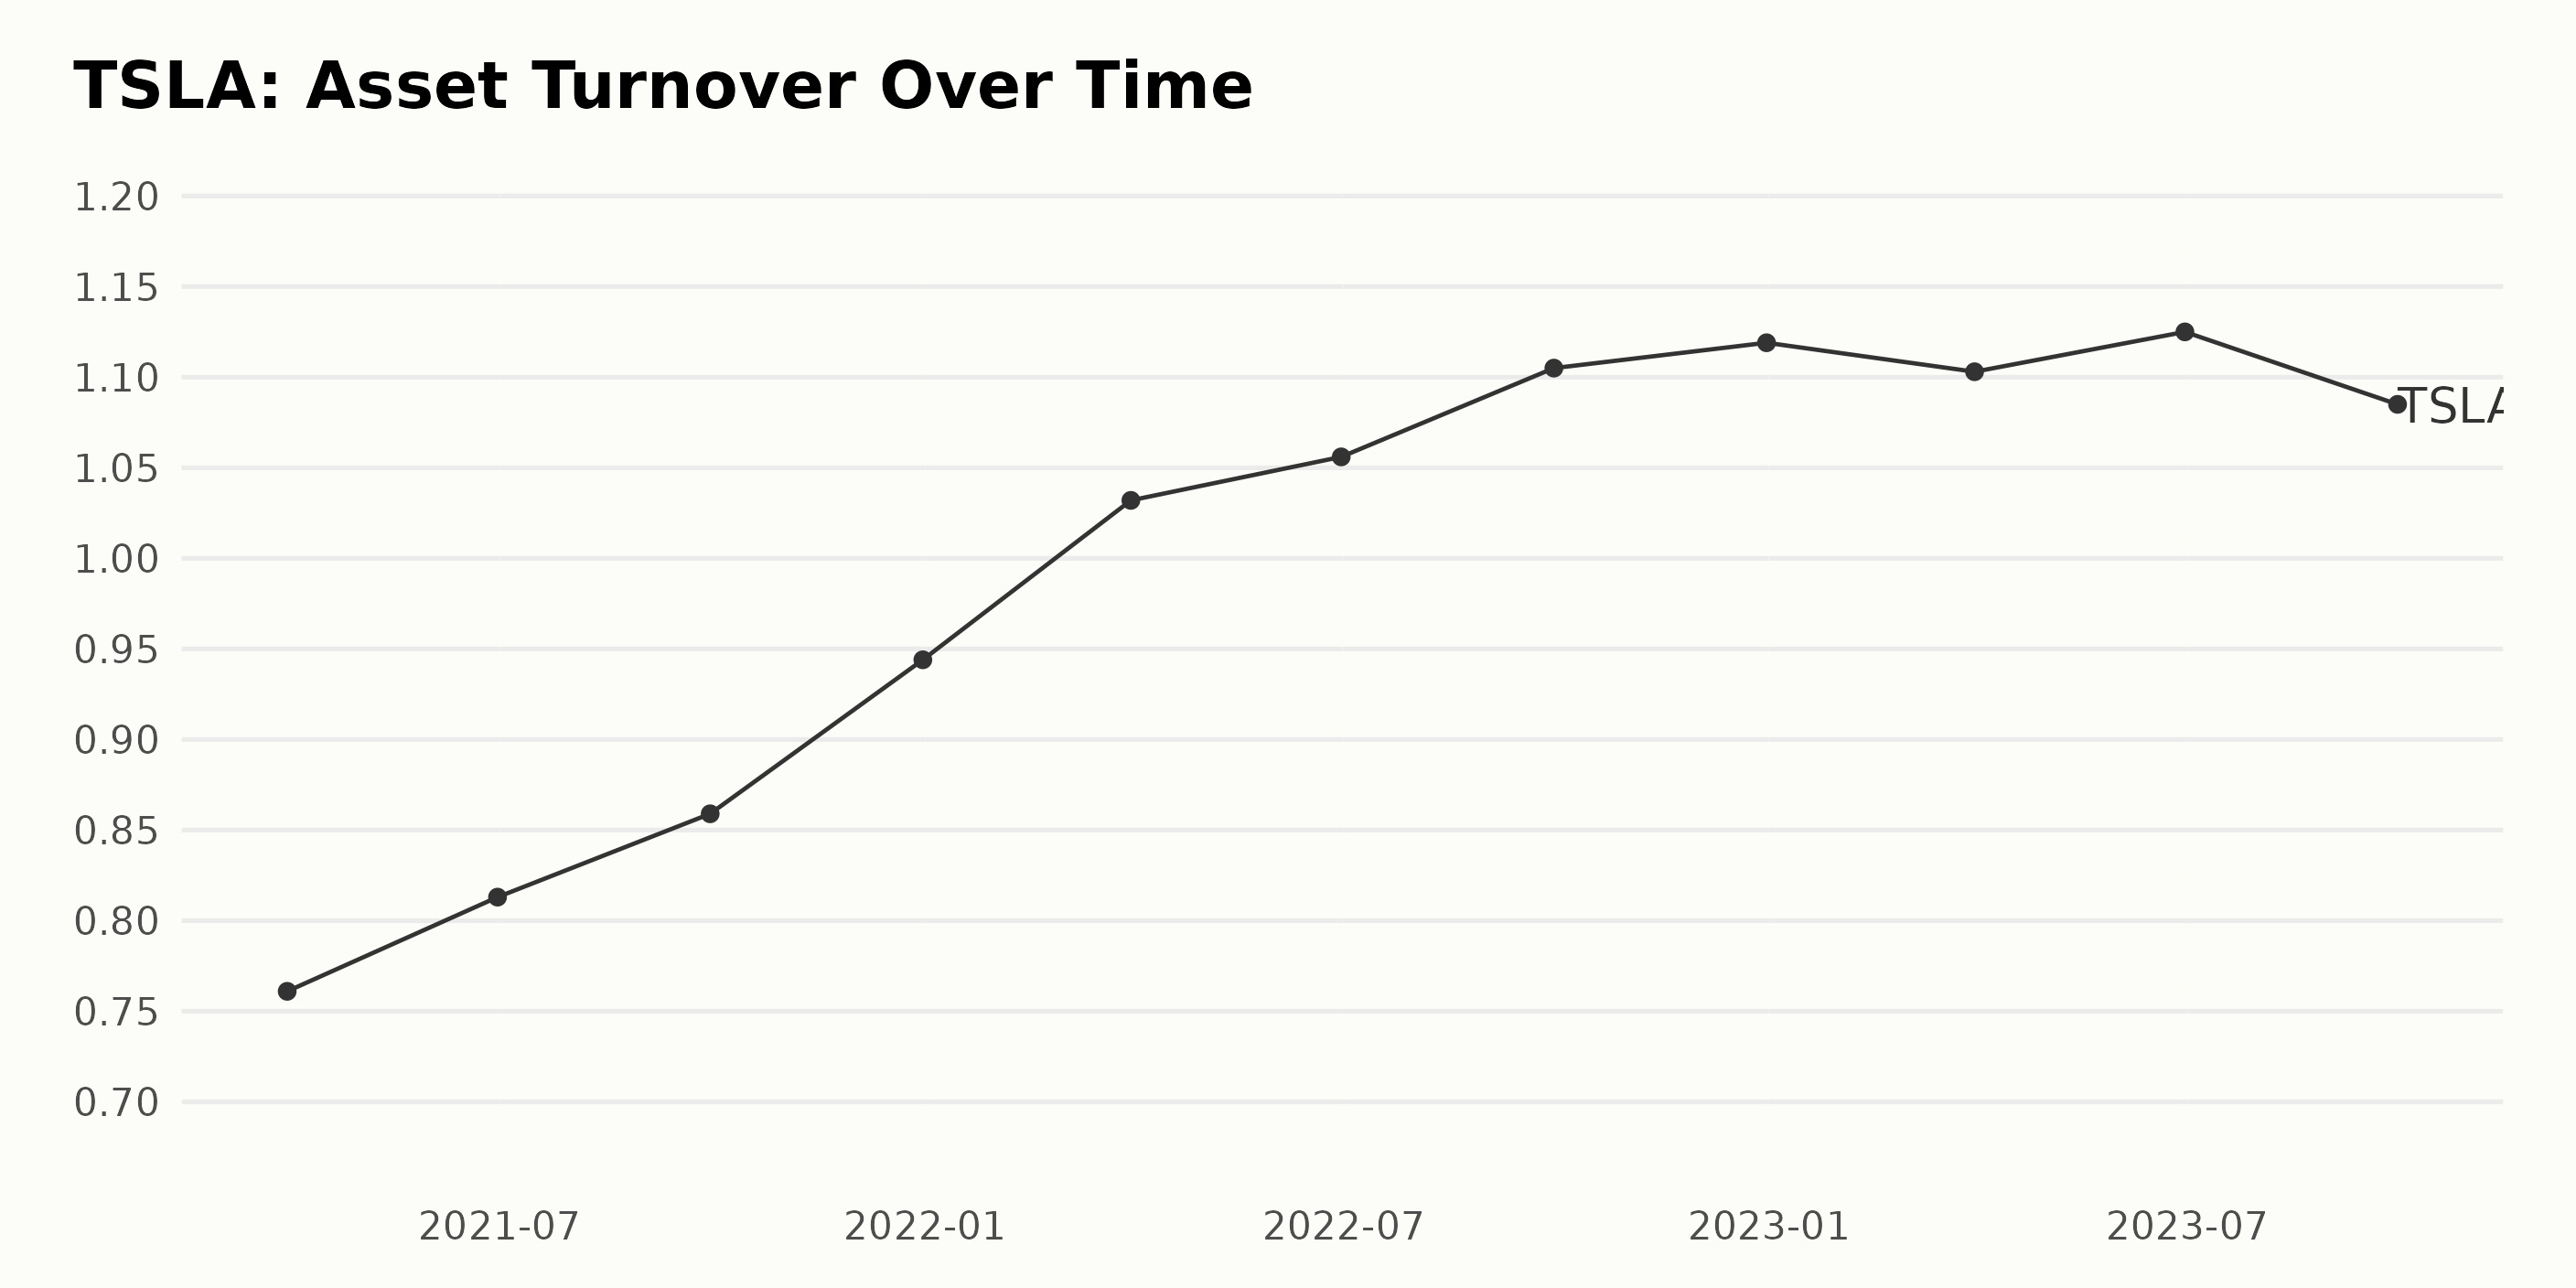
The data presents the Asset Turnover trends of TSLA spanning from March 2021 through September 2023.
- There was an increasing trend in TSLA's Asset Turnover from March 2021, which had a value of 0.76, till December 2022, where it reached a peak of 1.12. The growth rate during this period was calculated to be around 47.17%, indicating more efficient use of assets over time.
- However, the asset turnover experienced its first decline in the first quarter of 2023, dropping from 1.12 to 1.10, a decrease of about 1.43%.
- Subsequently, it slightly rose to 1.13 in June 2023 demonstrating a minor recovery, but dropped again in September 2023 to 1.09, marking a 3.56% drop from its value in June.
The overall trend demonstrates constant fluctuations. However, the value never dipped below the starting point of 0.76. Unsurprisingly, these fluctuations reveal the dynamic nature of the company's efficiency in using its assets to generate sales. Despite minor drops, Tesla Inc. seems to have improved its ability to utilize its assets over the analyzed period. Emphasis on recent data indicates a drop in asset turnover, which suggests the need for further analysis to understand the reasons behind it.
Tesla Inc.'s Volatile Share Prices: A Decreasing Trend from July 2023 to January 2024
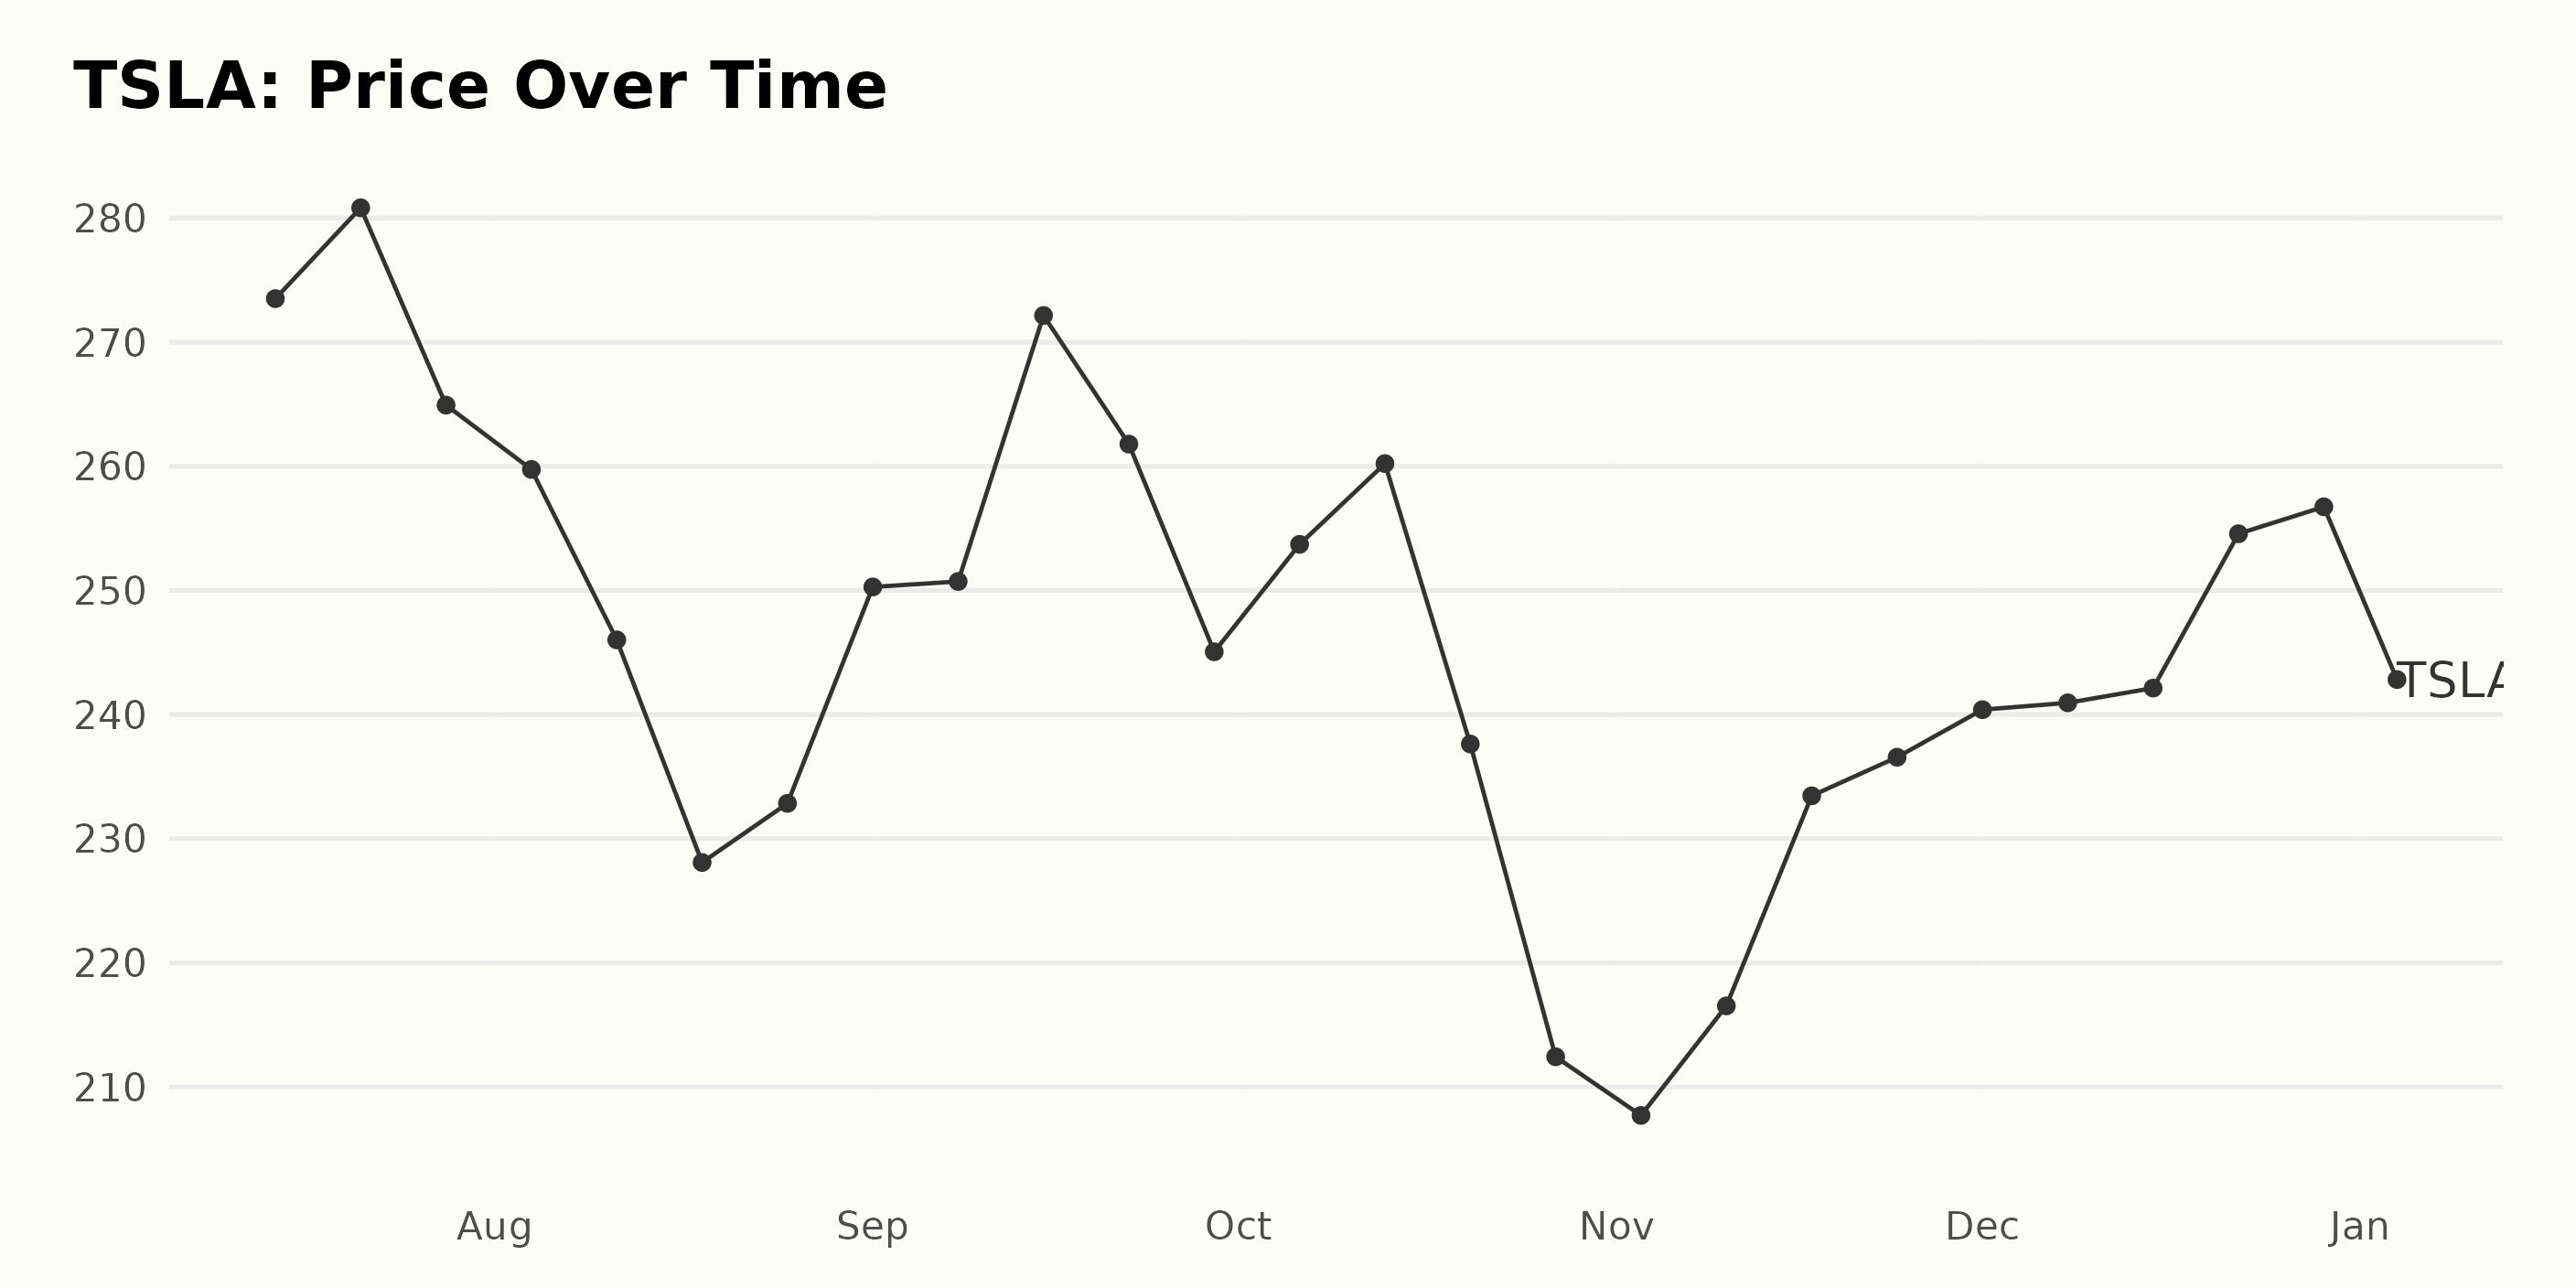
Upon assessment of the data provided, the share price of Tesla Inc. (TSLA) manifests an overall decreasing trend from July 2023 to January 2024. The fluctuations suggest a sequence of rises and falls however a generally notable deceleration in price through time is pronounced. The data reveals the following:
- On July 14, 2023, the share price was recorded at $273.51.
- A month later, on August 14, 2023, it dropped to $246.02, with a net decline of $27.49 in a month.
- From this point, it had heightened to $272.15 by September 15, 2023 but fell again to $245.06 by September 29, 2023.
- Following these fluctuations, the share price witnessed a further decrease and hit a low of $207.71 by November 3, 2023.
- Subsequently, there were minor increases, with the price getting to $240.94 on December 8, 2023.
- The highest price within this period was observed on December 29, 2023, at $256.74.
- By January 4, 2024, the price depreciated to $242.82, marking an approximately eleven percent decrease over six months.
With reference to the growth rate, it is not constant during this period, changing with the price's fluctuations. The growth rate essentially experienced significant troughs and crests throughout the second half of 2023 and the start of 2024. An evident peak in the growth rate is noticeable around mid-September 2023, whereas a principal dip occurred at the beginning of November 2023. The variable growth rates and decreasing overall price trend suggest volatility and depreciation in the value of shares for Tesla Inc. (TSLA) during this period. The data seems to mirror the typical unpredictability of the stock markets, oscillating due to miscellaneous market, economic, and company-specific factors causing instability in share prices. Here is a chart of TSLA's price over the past 180 days.
Analyzing Tesla's Quality, Momentum, and Growth Trends with POWR Ratings
TSLA has an overall D rating, translating to a Sell in our POWR Ratings system. It is ranked #39 out of the 59 stocks in the Auto & Vehicle Manufacturers category.
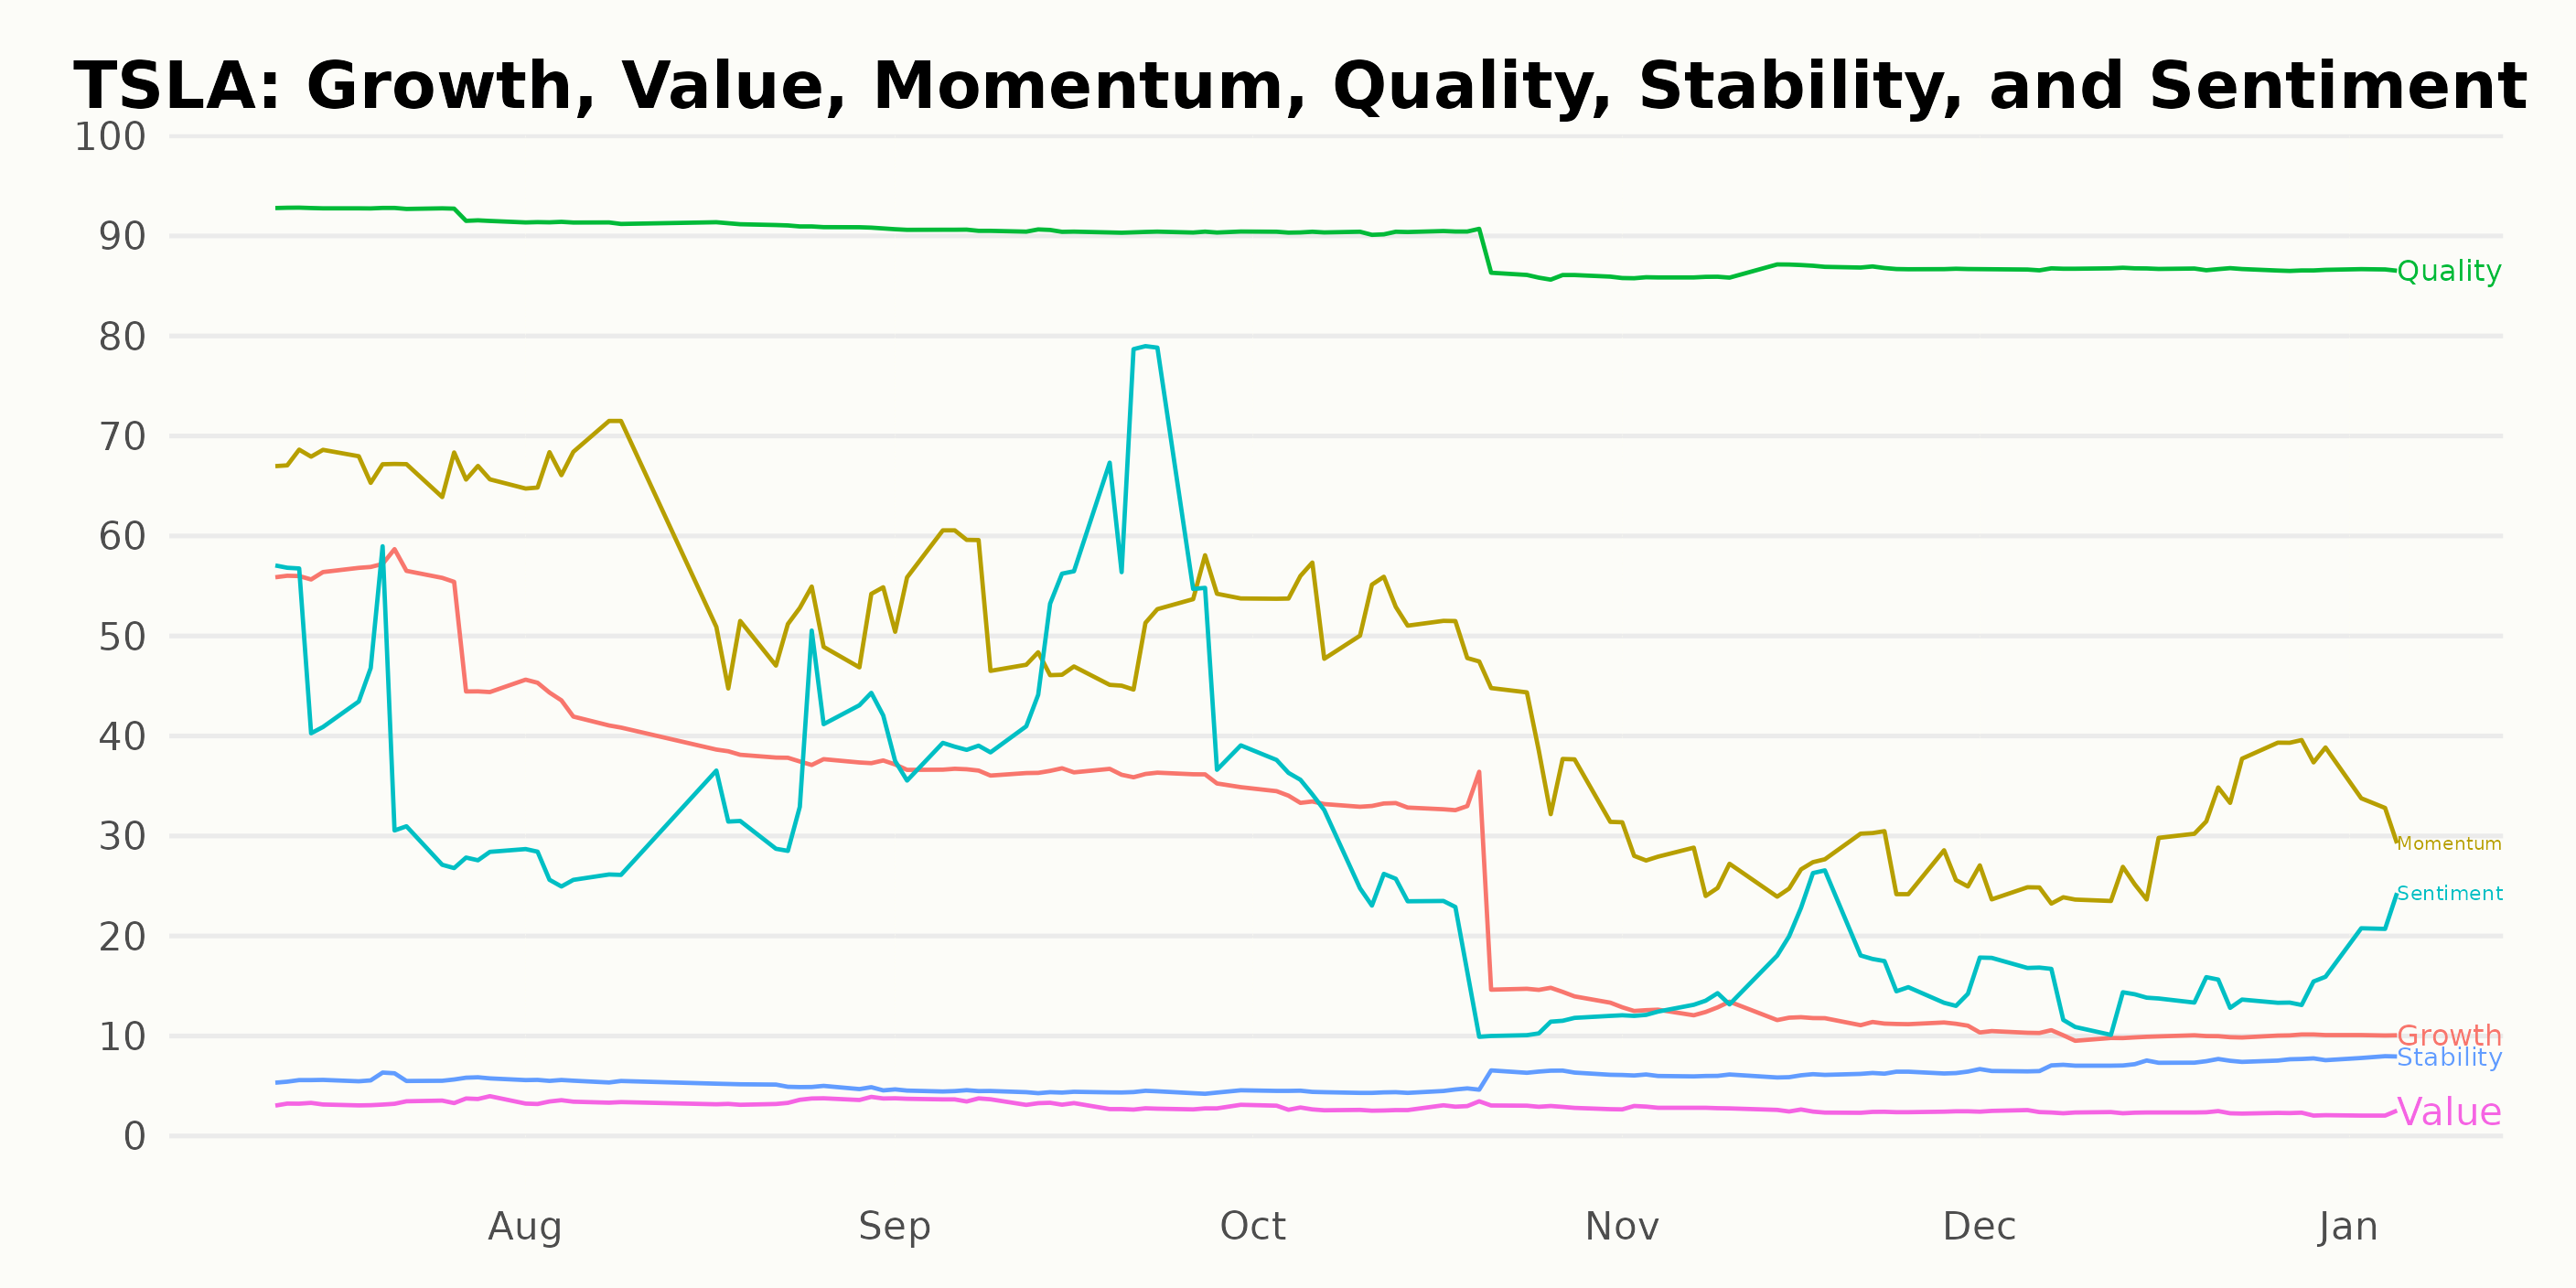
Based on the featured POWR Ratings, the three most noteworthy dimensions for Tesla Inc. (TSLA) throughout the period under review appear to be Quality, Momentum, and Growth. Let's take a closer look at these dimensions:
Quality: According to the ratings, Tesla's Quality consistently ranked highest among the six dimensions, even though it exhibited a slight downward trend. The ratings started at 93 in July 2023 and finished at 87 in January 2024. Thus, despite a decrease in numerical value, Quality maintained the top spot, indicating that the quality of Tesla's earnings and business operations remained relatively high.
Momentum: Momentum also emerged as an important dimension based on the given POWR Ratings. Though it experienced a significant drop from 67 in July 2023 to 32 in January 2024, Momentum sustained fairly strong ratings until towards the end of the period, suggesting Tesla's price change pace over time was largely favorable.
Growth: Growth was the third significant dimension evidenced by the consistent decline in its ratings. In July 2023, Growth stood at 54, and by January 2024, it had plummeted to 10. This persistent downward trajectory signals a steady reduction in Tesla's growth prospects over this period.
In summary, Quality was the highest-rated dimension for Tesla Inc., evidenced by its consistently top-ranking values. Momentum also carried significant weight despite a considerable decline over time. The most notable trend was reported within the Growth dimension, which showed an unequivocal decrease during the observation period.
How does Tesla Inc. (TSLA) Stack Up Against its Peers?
Other stocks in the Auto & Vehicle Manufacturers sector that may be worth considering are REV Group Inc. (REVG), Isuzu Motors Limited (ISUZY), and Suzuki Motor Corp. (SZKMY) -- they have better POWR Ratings.
What To Do Next?
Get your hands on this special report with 3 low priced companies with tremendous upside potential even in today’s volatile markets:
3 Stocks to DOUBLE This Year >
TSLA shares were trading at $239.06 per share on Friday afternoon, up $1.13 (+0.47%). Year-to-date, TSLA has declined -3.79%, versus a -1.42% rise in the benchmark S&P 500 index during the same period.
About the Author: Subhasree Kar

Subhasree’s keen interest in financial instruments led her to pursue a career as an investment analyst. After earning a Master’s degree in Economics, she gained knowledge of equity research and portfolio management at Finlatics.
The post Tesla (TSLA) Stock Outlook: Will it Ride the Tech Wave in 2024? appeared first on StockNews.com