

While the beverage company Constellation Brands, Inc. (STZ) surpassed analyst predictions for both revenue and earnings in the fiscal first quarter primarily due to higher pricing and steady demand for its alcoholic beverages, its margins experienced a contraction due to the impact of rising raw material costs and heightened marketing expenditures. Its operating income also declined 6.8% year-over-year to $764.70 million.
Moreover, in June, STZ’s Modelo Especial achieved a significant feat by surpassing Anheuser-Busch InBev SA/NV’s (BUD) Bud Light to become the best-selling beer in the U.S. However, this transition was prompted by the latter's encounter with public backlash following a social media promotion involving transgender influencer Dylan Mulvaney.
Moreover, given the current inflationary environment and elevated interest rates, potential investors might find it beneficial to hold off now for a more opportune entry point into the stock.
STZ’s Financial Performance: Analyzing Net Income, P/E Ratio, Gross Margin, ROIC, and ROA
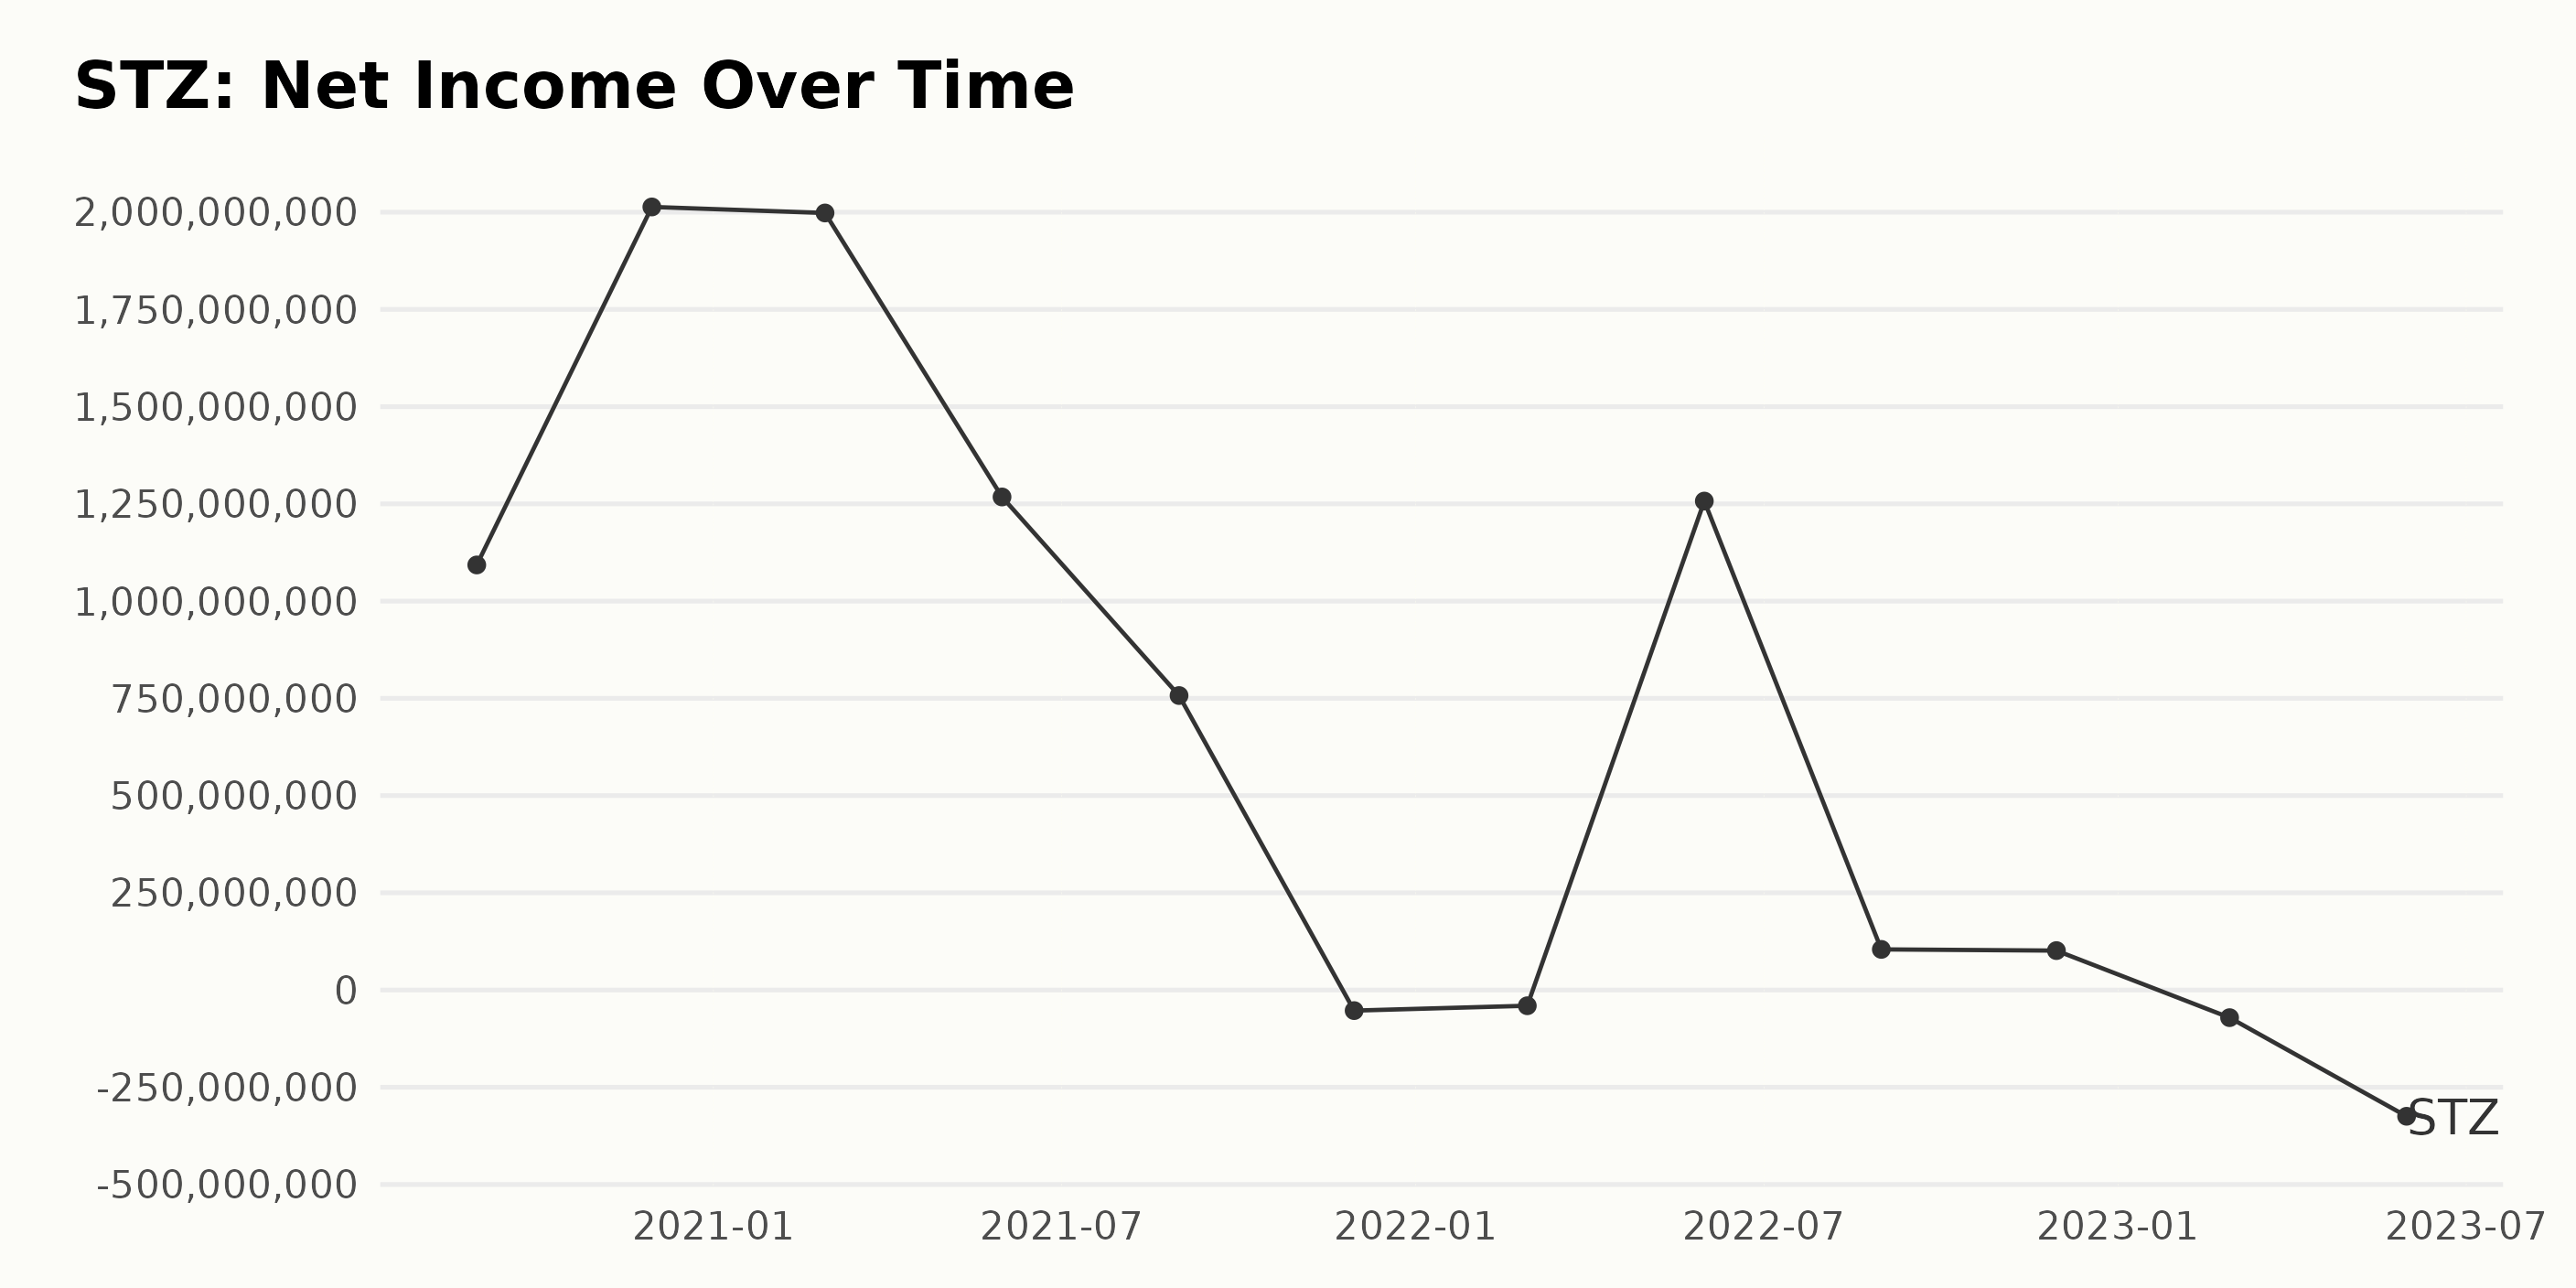
STZ’s trailing-12-month net income has witnessed several fluctuations with varying degrees of significance between August 2020 and May 2023. Here are the key Observations:
- In August 2020, STZ reported a net income of $1.09 billion.
- There was significant growth in net income by November 2020 to approximately $2.01 billion.
- However, a minor decrease was reported by February 2021, when net income reached $1.99 billion.
- A more substantial decrease was observed by May 2021, with a net income of $1.26 billion.
- By August 2021, it dropped sharply to $757.20 million.
- The company faced losses in the following months, with a net loss of $52.90 million in November 2021 and $40.40 million in February 2022.
- By May 2022, the company rebounded to a profitable state, reporting a net income of $1.25 billion.
- However, a significant drop was noticed again by August 2022 as net income slumped to $104.50 million. This trend continued until November 2022, with a slight decrease to $101.4 million.
- In February 2023, the company faced a loss of $71 million again, further escalating to $324.6 million by May 2023.
With respect to the growth rate, comparing the first value from August 2020 ($1.09 billion) to the last reported loss in May 2023 ($324.60 million), STZ has seen a significant negative growth rate. It suggests that, despite several upturns, STZ’s overall net income trend has been largely negative in the examined interval, demonstrating the prominence of more recent downturns.
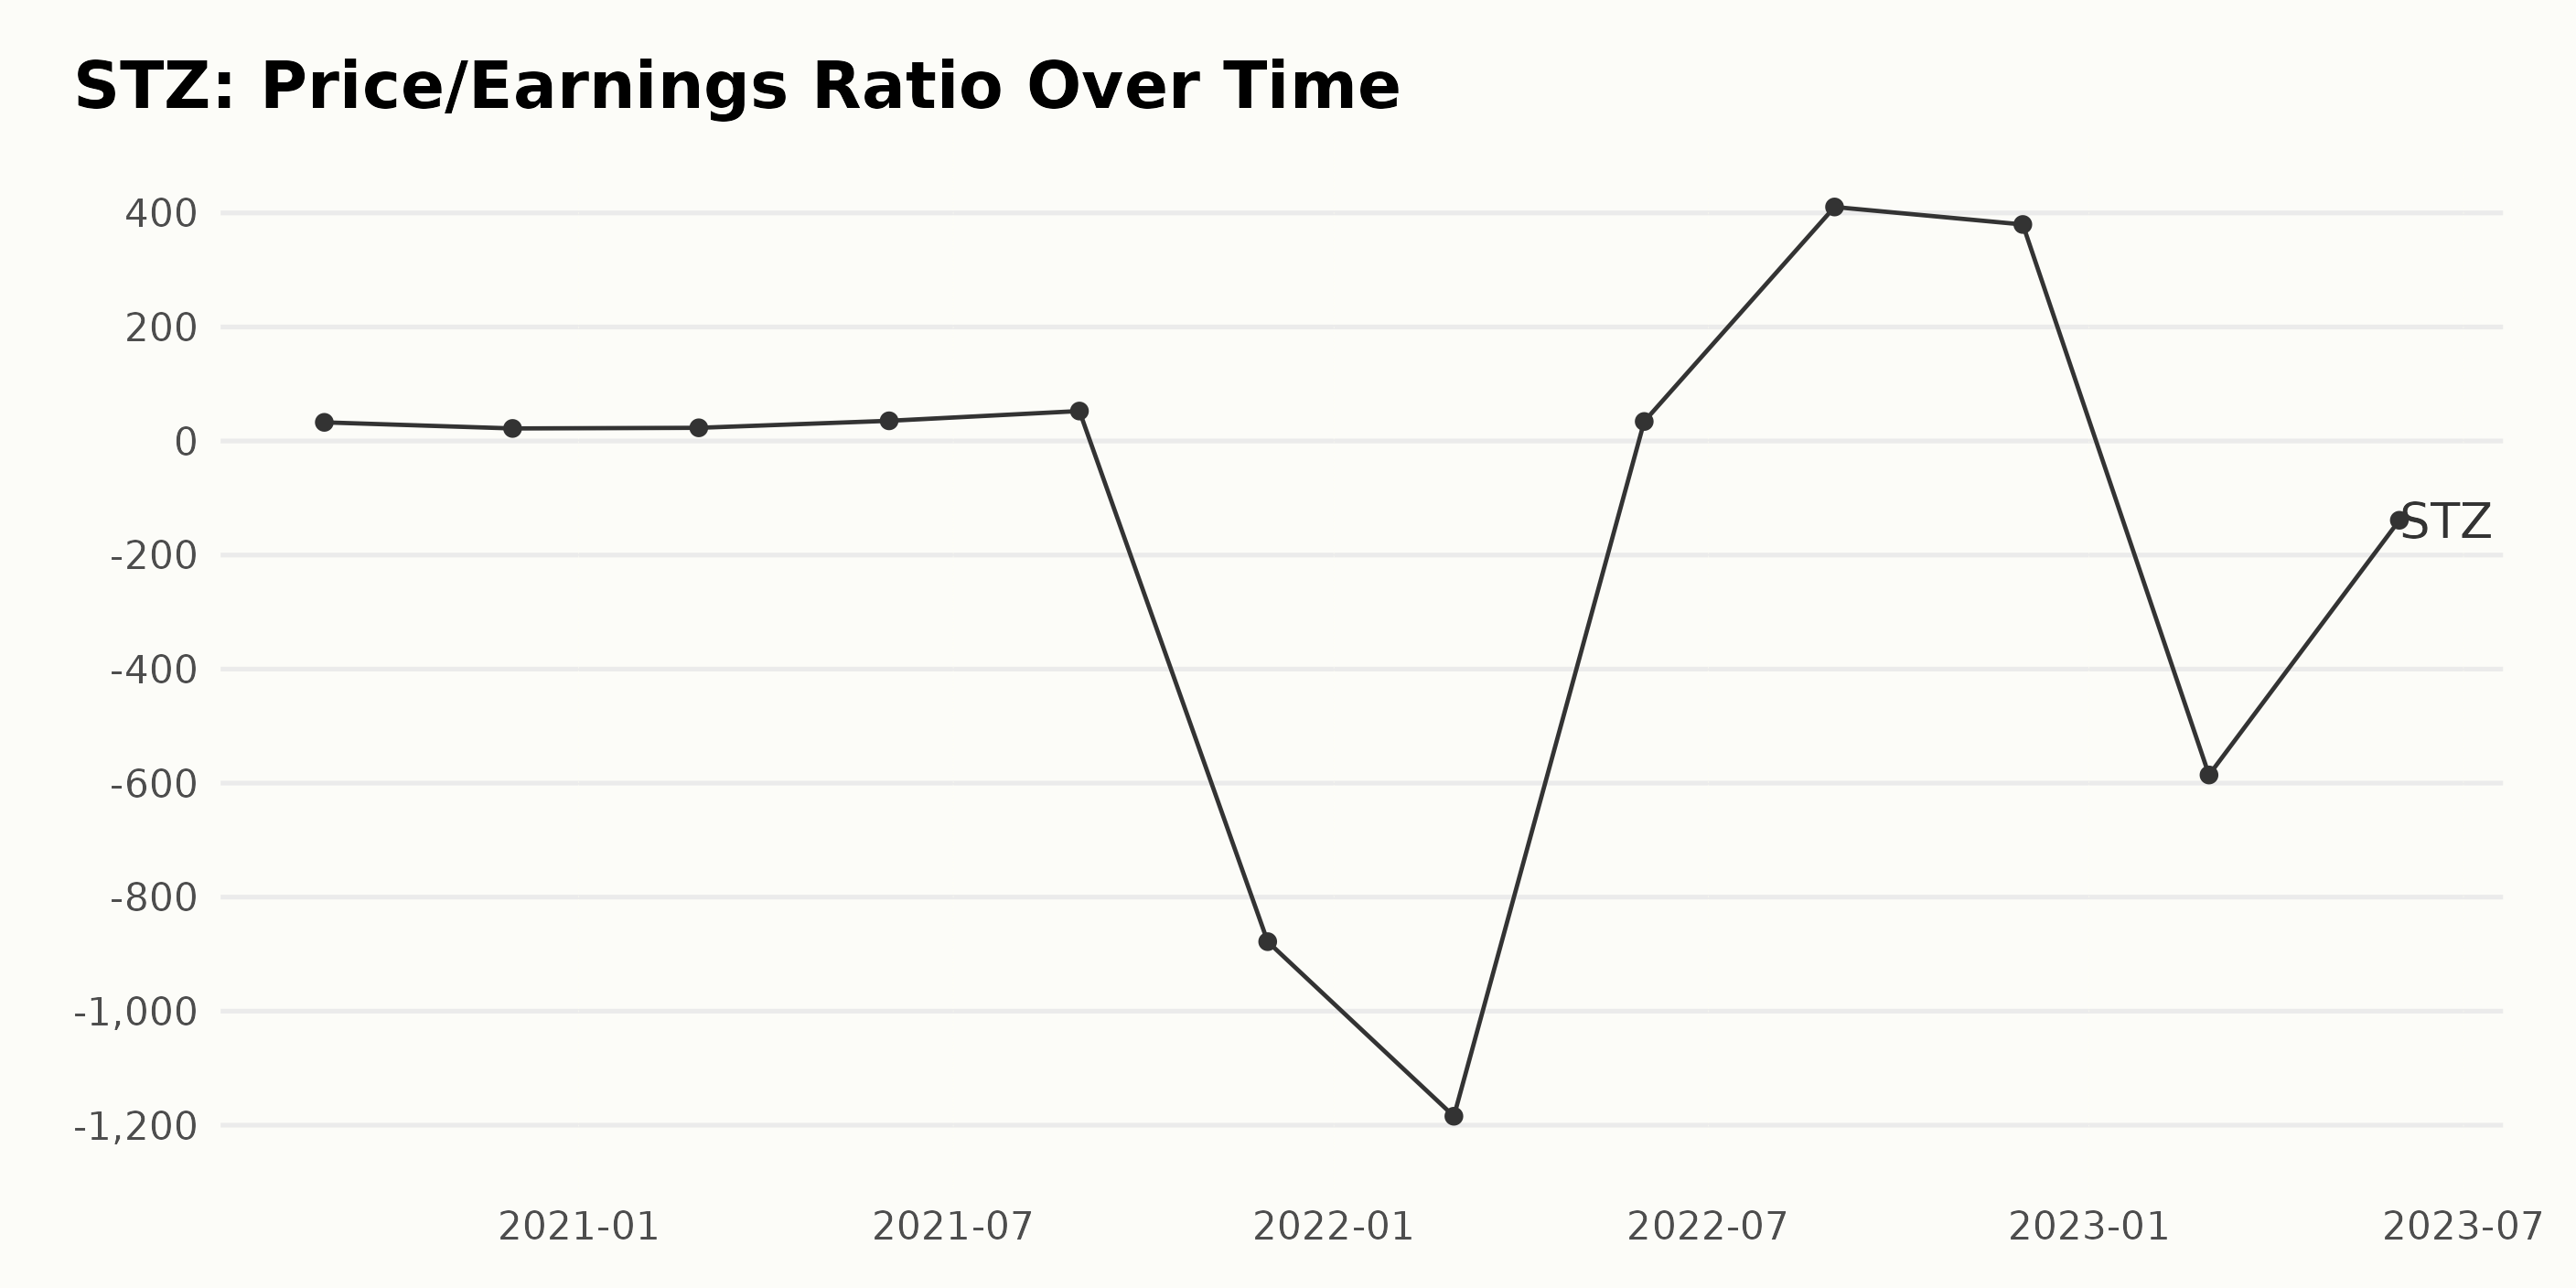
STZ’s Price/Earnings Ratio (P/E) has seen considerable fluctuations over the period from August 2020 to May 2023. Here are some critical observations:
- In August 2020, STZ had a P/E of 32.73, which subsequently fell to 22.04 by November 2020. This indicates a 32% decline.
- However, by February 2021, there was a slight recovery, with the P/E ratio reaching 23.14. This uptrend quickly escalated, with the P/E spiking to 35.43 in May 2021.
- The P/E shot up quite remarkably and peaked at 52.57 in August 2021.
- After this peak, a significant event occurred with the P/E turning negative, to -878.12 in November 2021, it kept falling until it reached -1184.33 in February 2022.
- All of a sudden, the ratios turned positive again, showing a P/E of 34.26 in May 2022.
- From this point onwards, P/E saw another high, reaching 410.49 by August 2022, only to slightly dip down to 379.80 in November 2022.
- Early and mid-2023 witnessed negative P/E with -585.77 and -139.01 in February and May 2023, respectively.
In conclusion, the P/E ratio for Constellation Brands varied wildly over this time frame, from around 32.73 in August 2020 to -139.01 by May 2023. These drastic fluctuations in PE values point towards significant volatility in either the stock price, company earnings, or both.
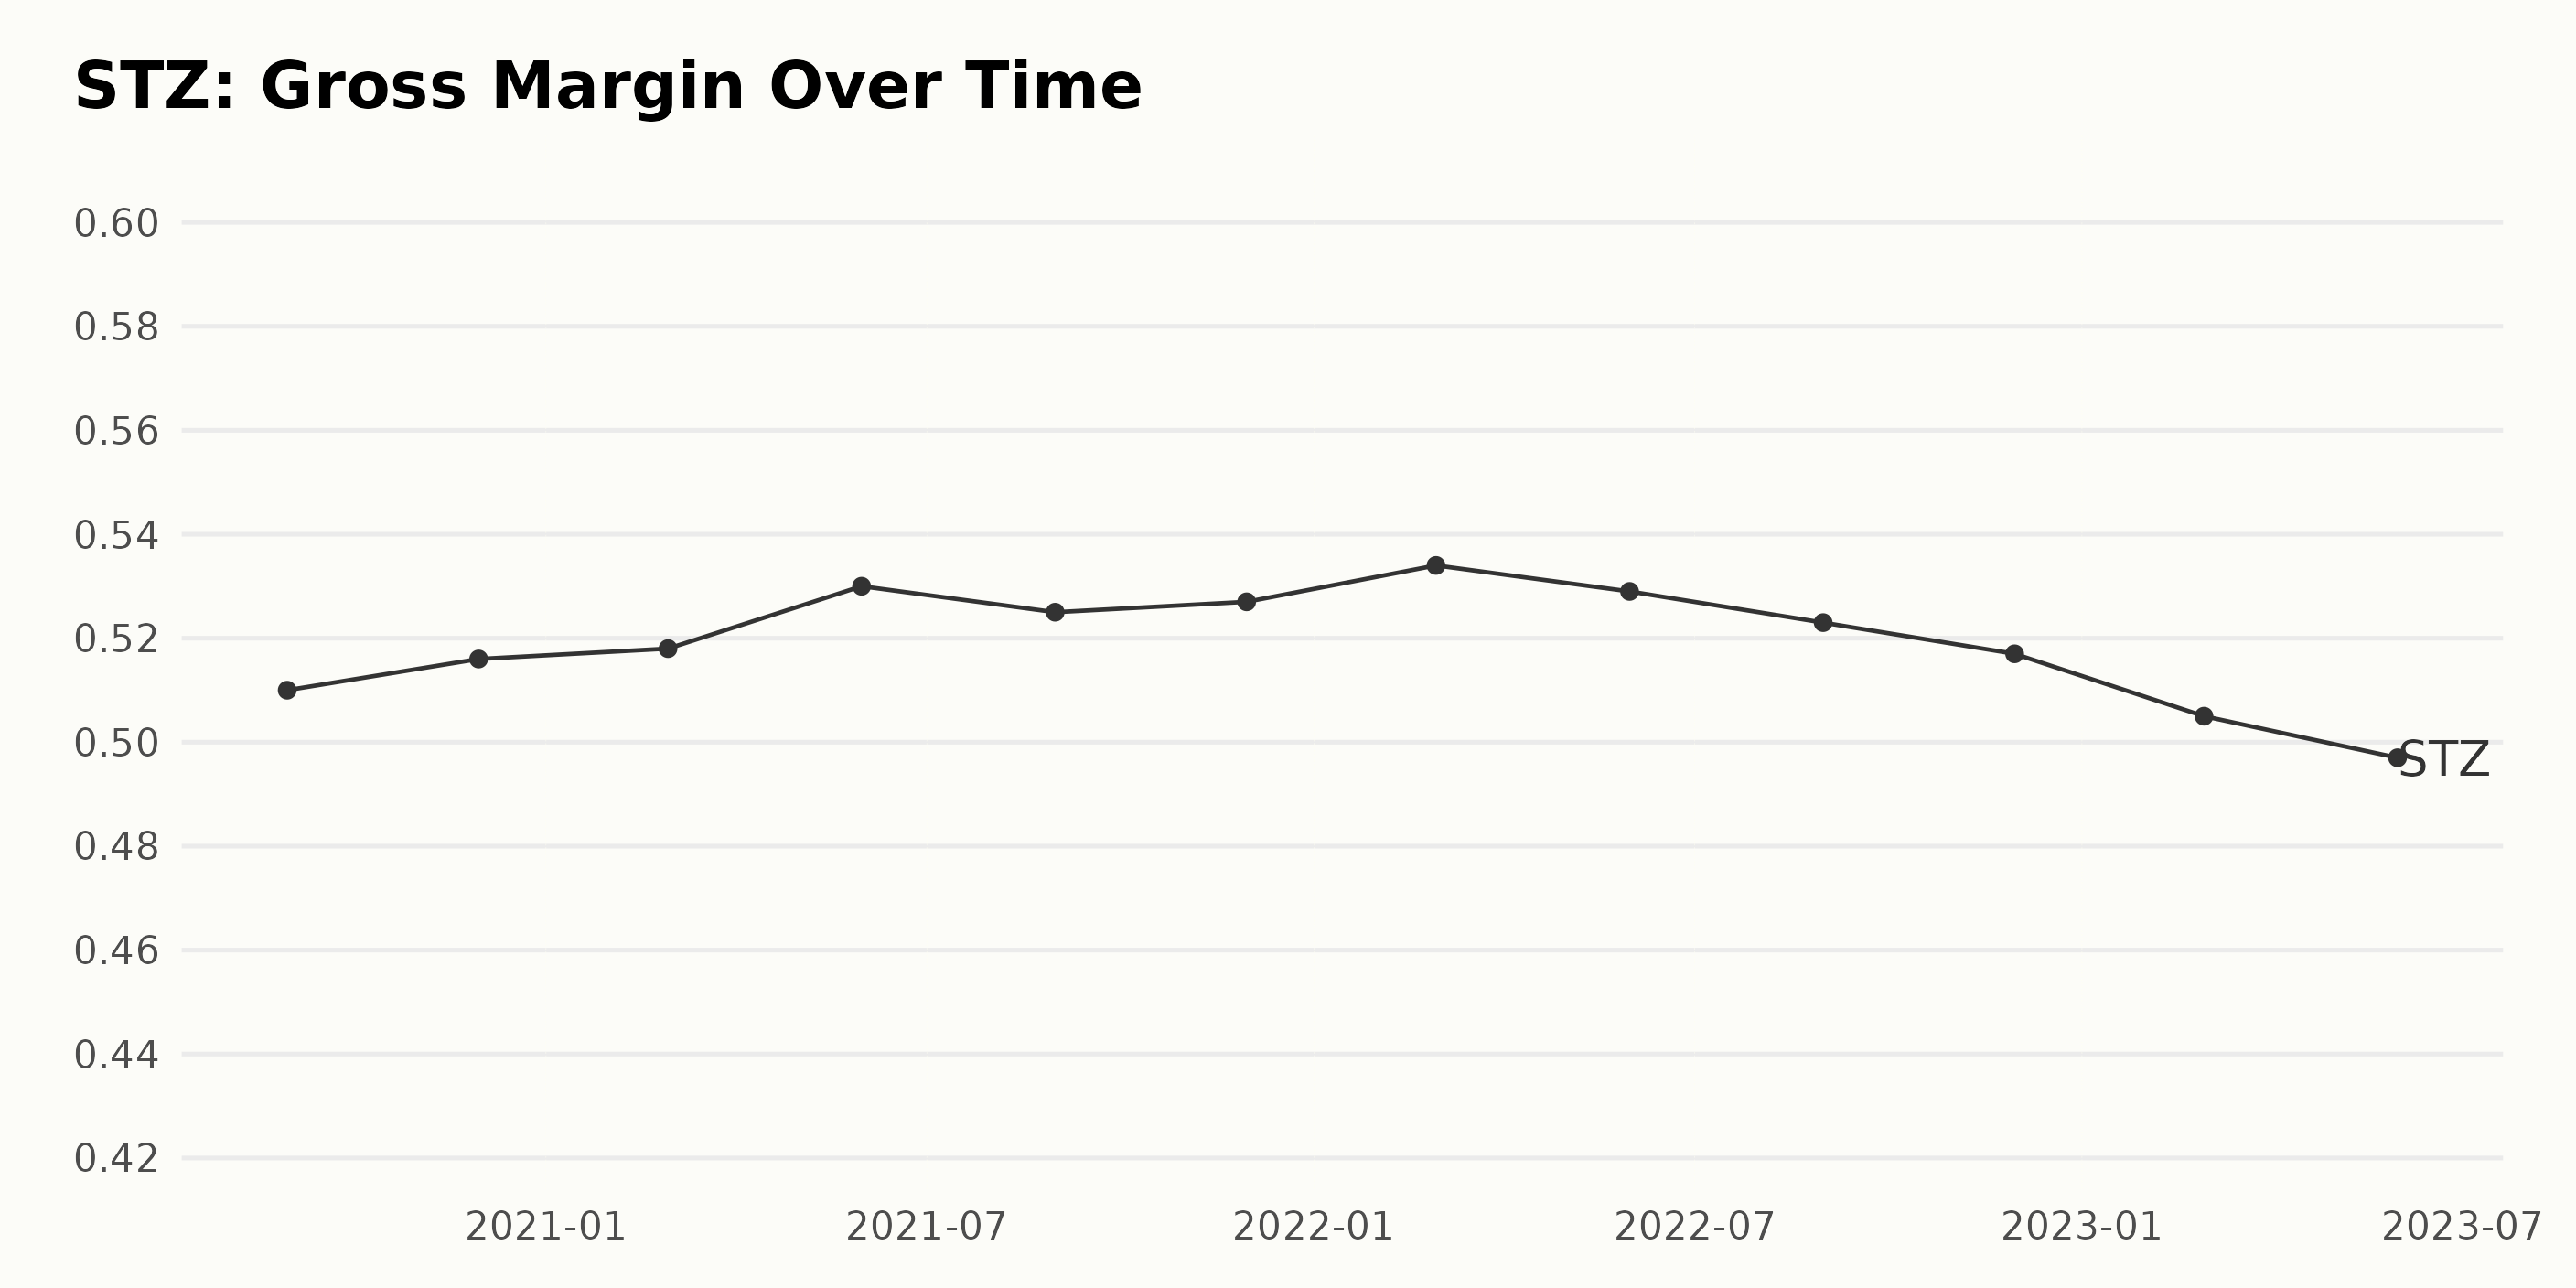
STZ’s Gross Margin has demonstrated a fluctuating trend over the specified period. To analyze this, we must first multiply the original value by 100 and append all resulting values with a percent sign.
- August 2020: The gross margin was 51%
- November 2020: It subtly rose to 51.6%
- February 2021: It remained pretty stable as it saw a slight increment to 51.8%
- May 2021: Then, there was a significant growth to 53%
- August 2021: It slightly fell back to 52.5%
In recent times, more fluctuations were noticed:
- November 2021: Gross margin inched up a little to 52.7%
- February 2022: It took a small growth leap to 53.4%
- May 2022: However, it decreased subtly to 52.9%
- August 2022: Another decrease was observed as it moved down to 52.3%
- November 2022: It dipped further to 51.7%
In the last reported values:
- February 2023: There was a sharper drop to 50.5%
- May 2023: This trend continued to 49.7%
Throughout this phase, from August 2020 till May 2023, the STZ’s gross margin generally declined. As we measure the growth rate from the beginning to the end of the span, the company's gross margin decreased by 1.3%. Ultimately, it's important to highlight that while there were periods of rise and plateau, the overall trend that emerges from this data is a gradual decline in STZ’s gross margin over this almost three-year period.
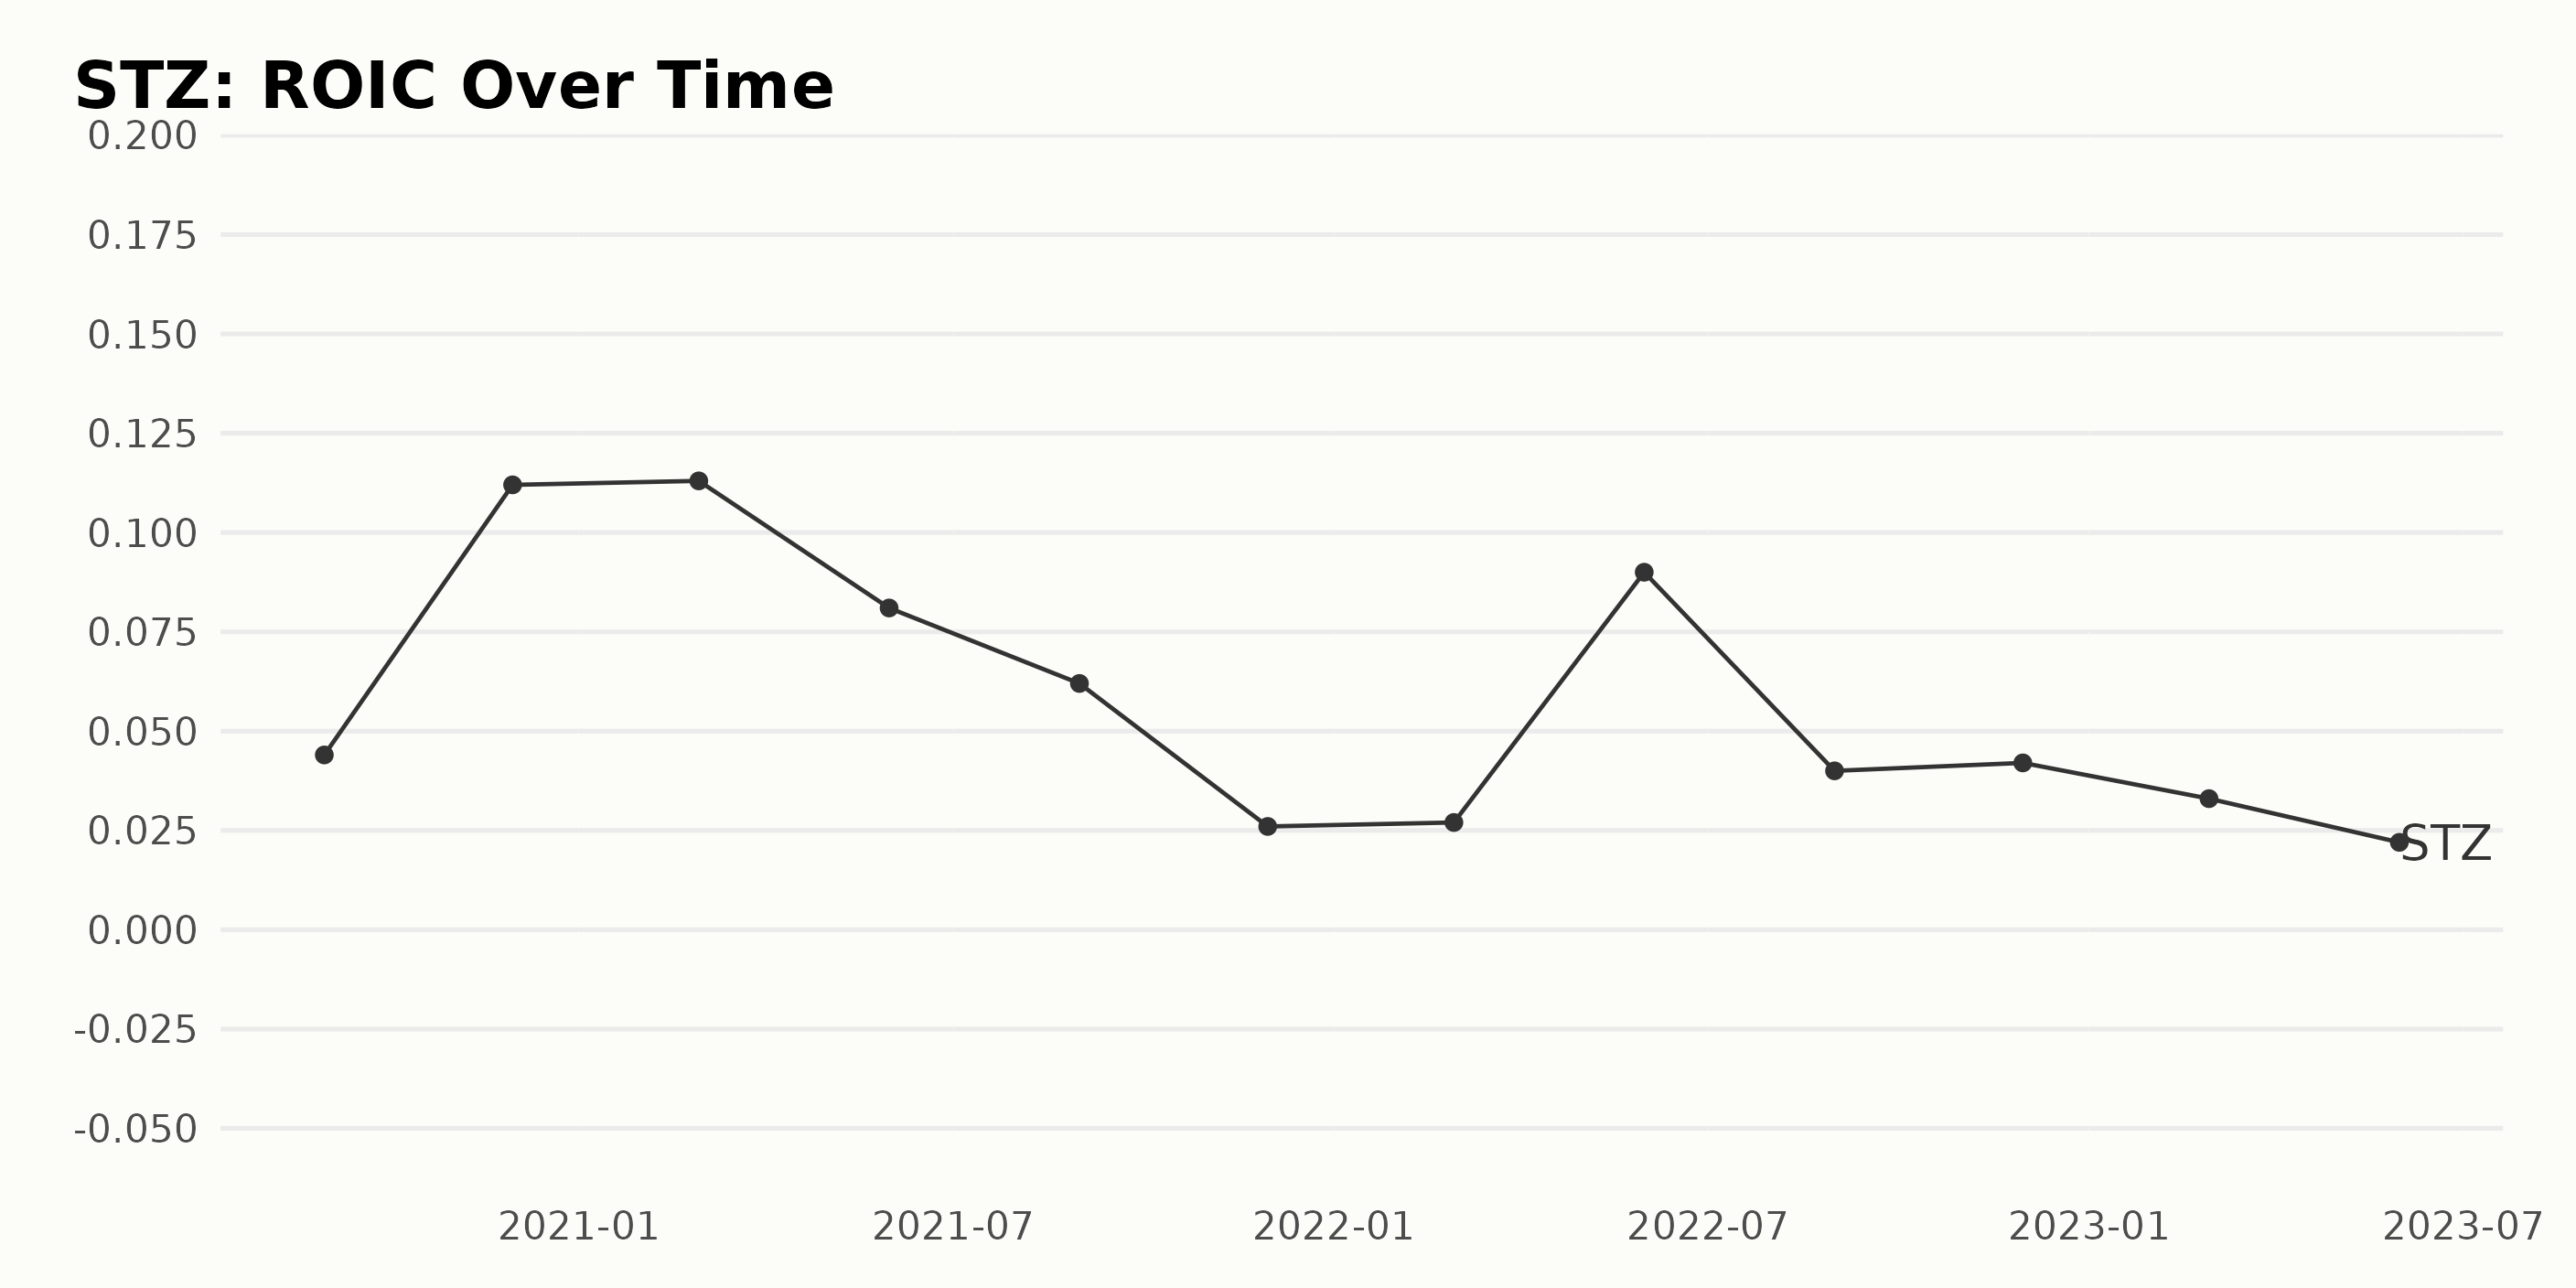
STZ’s Return on Invested Capital (ROIC) trend has seen notable fluctuations from August 2020 to May 2023. During this period, the ROIC ranged from a low of 0.022 in May 2023 to a high of 0.113 in February 2021. Here are some key data points:
- In the initial months, STZ experienced a significant growth in ROIC from 0.044 in August 2020 to its peak of 0.113 in February 2021.
- However, by May 2021, the ROIC decreased to a value of 0.081, a decline from the February high.
- The last half of 2021 showed a declining trend ending with an ROIC of 0.026 in November and only slightly rising to 0.027 by February 2022.
- A sudden but temporary recovery was observed in May 2022, where the figure shot up to 0.09 but declined sharply to 0.04 by August 2022.
- ROIC went from 0.042 in November 2022 to 0.033 in February 2023.
- Despite these minor increases, the final data point showcases another decrease as the ROIC dropped to 0.022 in May 2023.
In terms of the overall growth rate, calculated by comparing the first and last values, there was a noticeable decrease in the ROIC from the starting value of 0.044 in August 2020 to the latest value of 0.022 in May 2023.
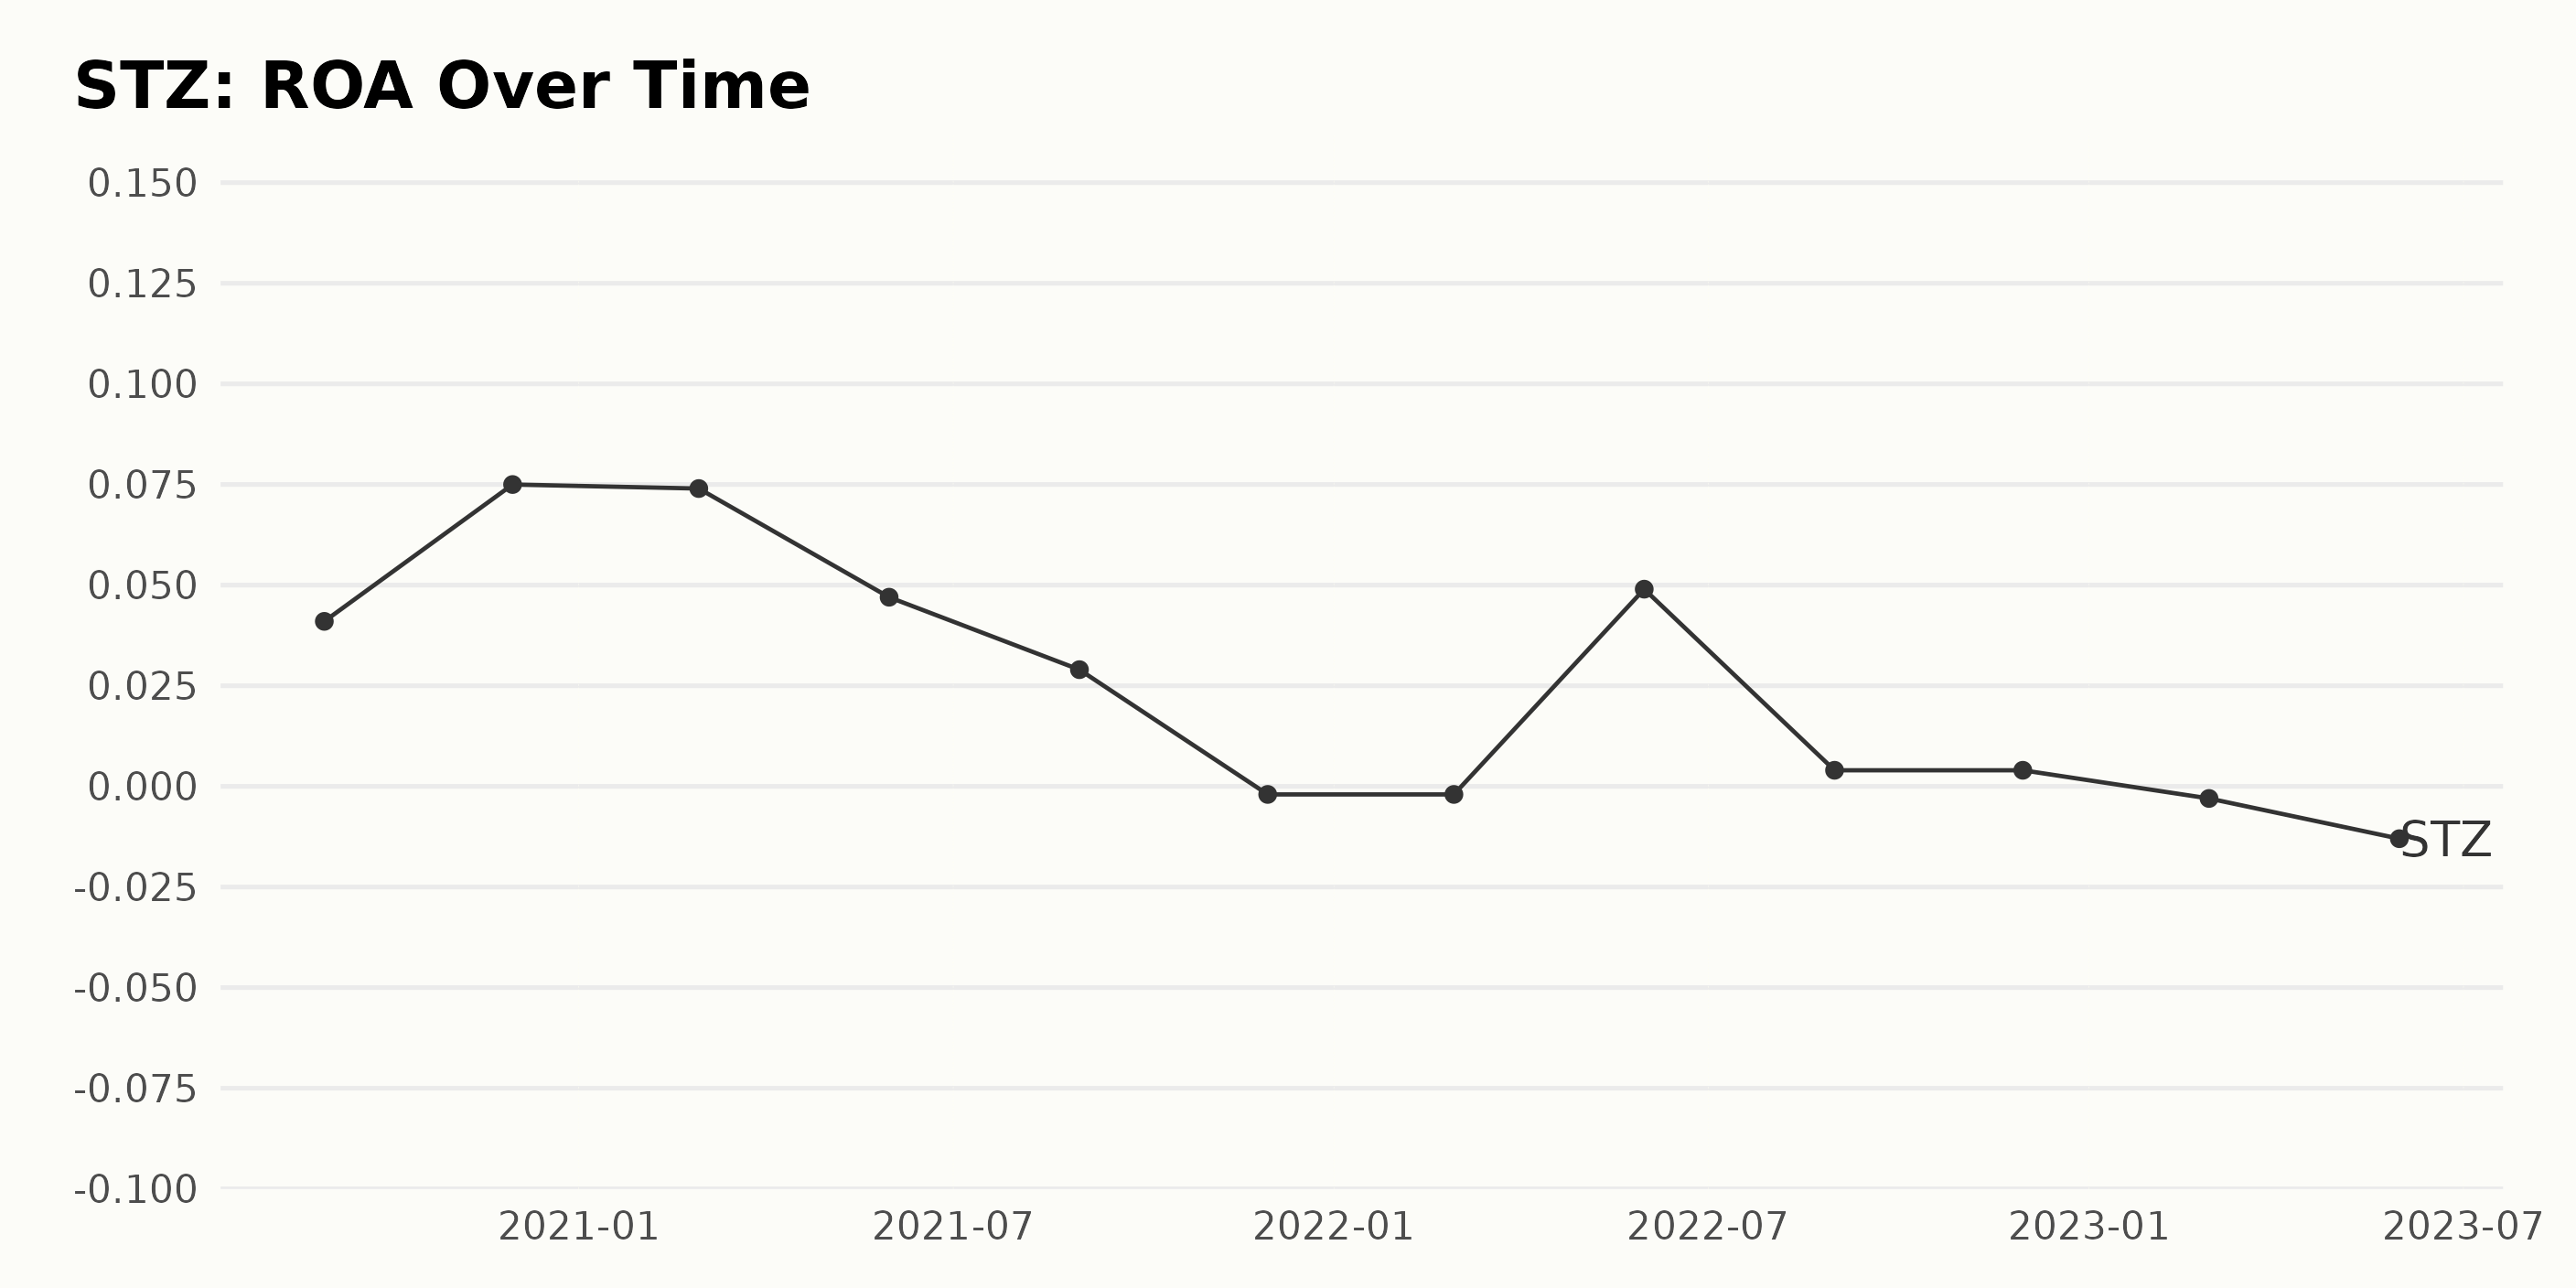
Here's a concise summary of the trend and fluctuations in ROA for STZ:
- August 2020: The series starts with STZ's ROA at 4.1%.
- November 2020: The ROA increased significantly to reach 7.5%.
- February 2021: There was a minor decrease in ROA to 7.4%.
- May 2021: A larger decline happened, and ROA dropped to 4.7%.
- August 2021: This downward trend continued, and ROA dropped to 2.9%.
- November 2021 - February 2022: During these periods, the ROA took a notable turn and fell into negative territory at -0.2%.
- May 2022: There was a substantial recovery as it climbed back into the positive zone at 4.9%.
- August 2022 - November 2022: This recovery didn't last long; ROA sharply dropped and plateaued at 0.4%.
- February 2023: Again, the ROA of STZ slipped into negative territory, standing at -0.3%.
- May 2023: Recently, STZ's ROA has been experiencing a downward trend and further dipped to -1.3%.
Please note that the overall growth rate over this period, as measured from the first value to the last, represents a decrease of approximately 536%. Emphasizing more recent data, it is apparent that it has been struggling with its returns since late 2021, with the ROA frequently dipping into the negatives.
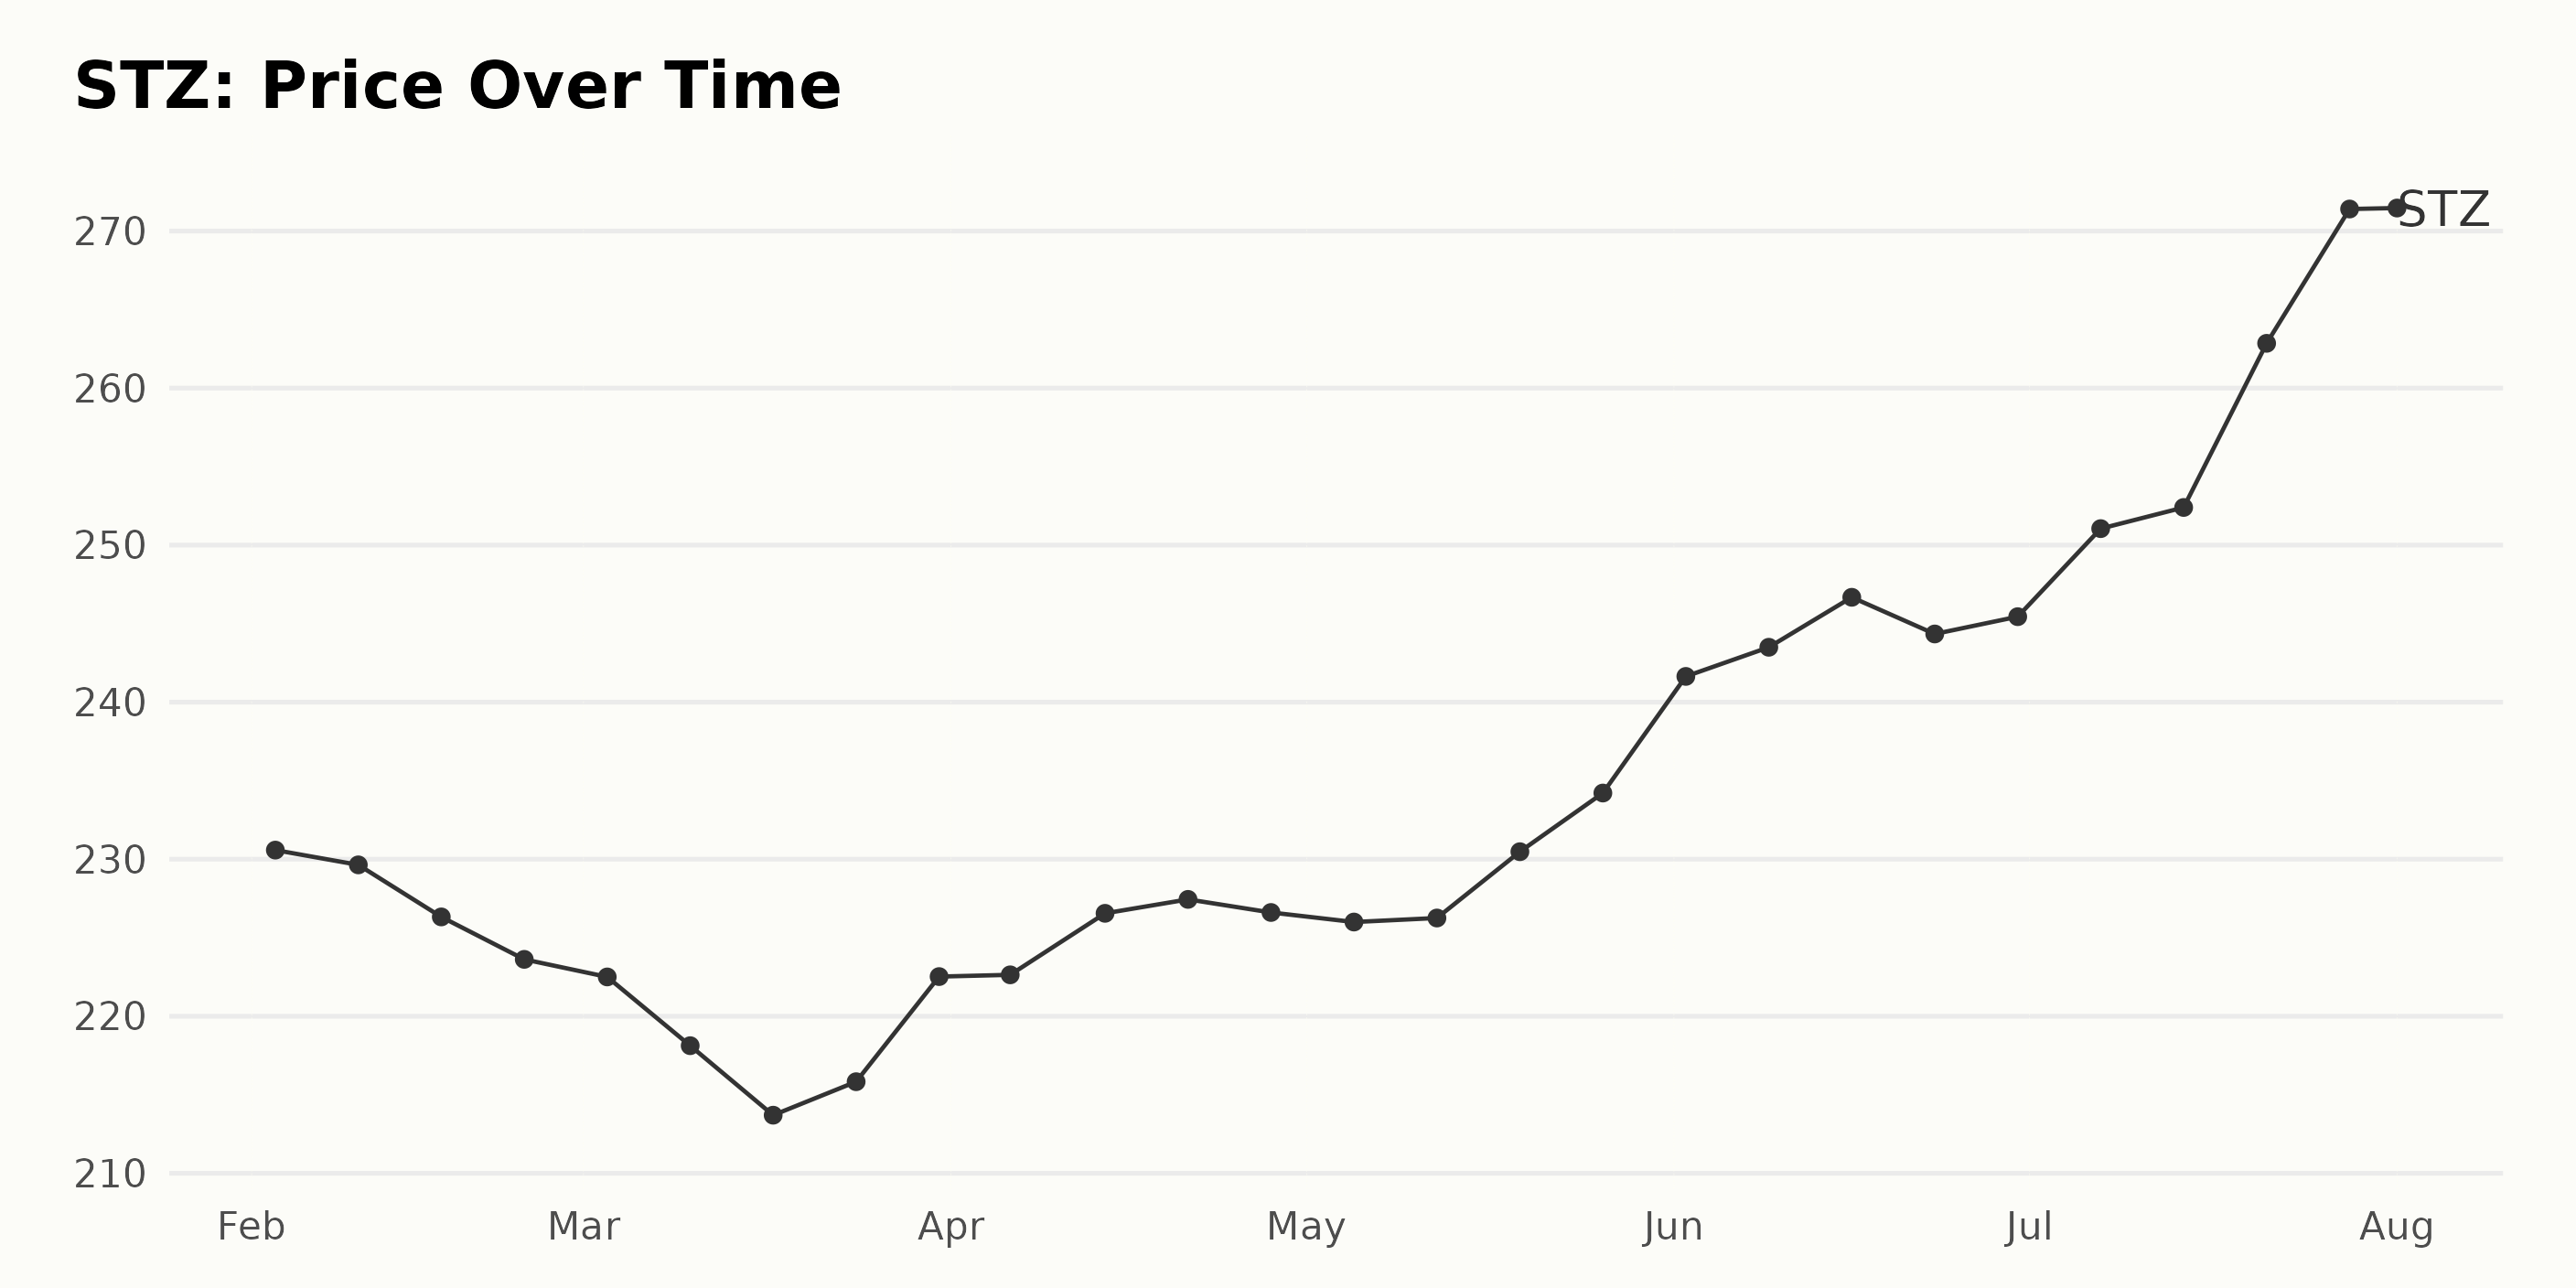
STZ‘s Six-Month Performance: Initial Decline Followed by Appreciable Growth
STZ’s shares display a clear trend in the given data sample from February 3, 2023, to August 1, 2023. Detailed specifics are as follows:
- The share price started at $230.58 on February 3, 2023.
- There was an overall declining trend through most of February and March, reaching a low of $213.7 on March 17, 2023.
- Following this, a slight recovery is recorded with a few fluctuations up to April 2023, with the share price rising to $227.44 by April 21, 2023.
- In May 2023, the share price remains relatively stable, with minor oscillations around the $226-$230 mark.
- A consistent upward trend is noticeable starting from late May, accelerating into June and July, with the share prices reaching a peak of $271.40 by July 28, 2023.
Thus, the growth rate of STZ’s share prices over this period indicates initially a slight downward trend followed by stabilization and subsequent appreciable growth, showing an impressive rate acceleration especially towards the end of the available dataset. Here is a chart of STZ's price over the past 180 days.
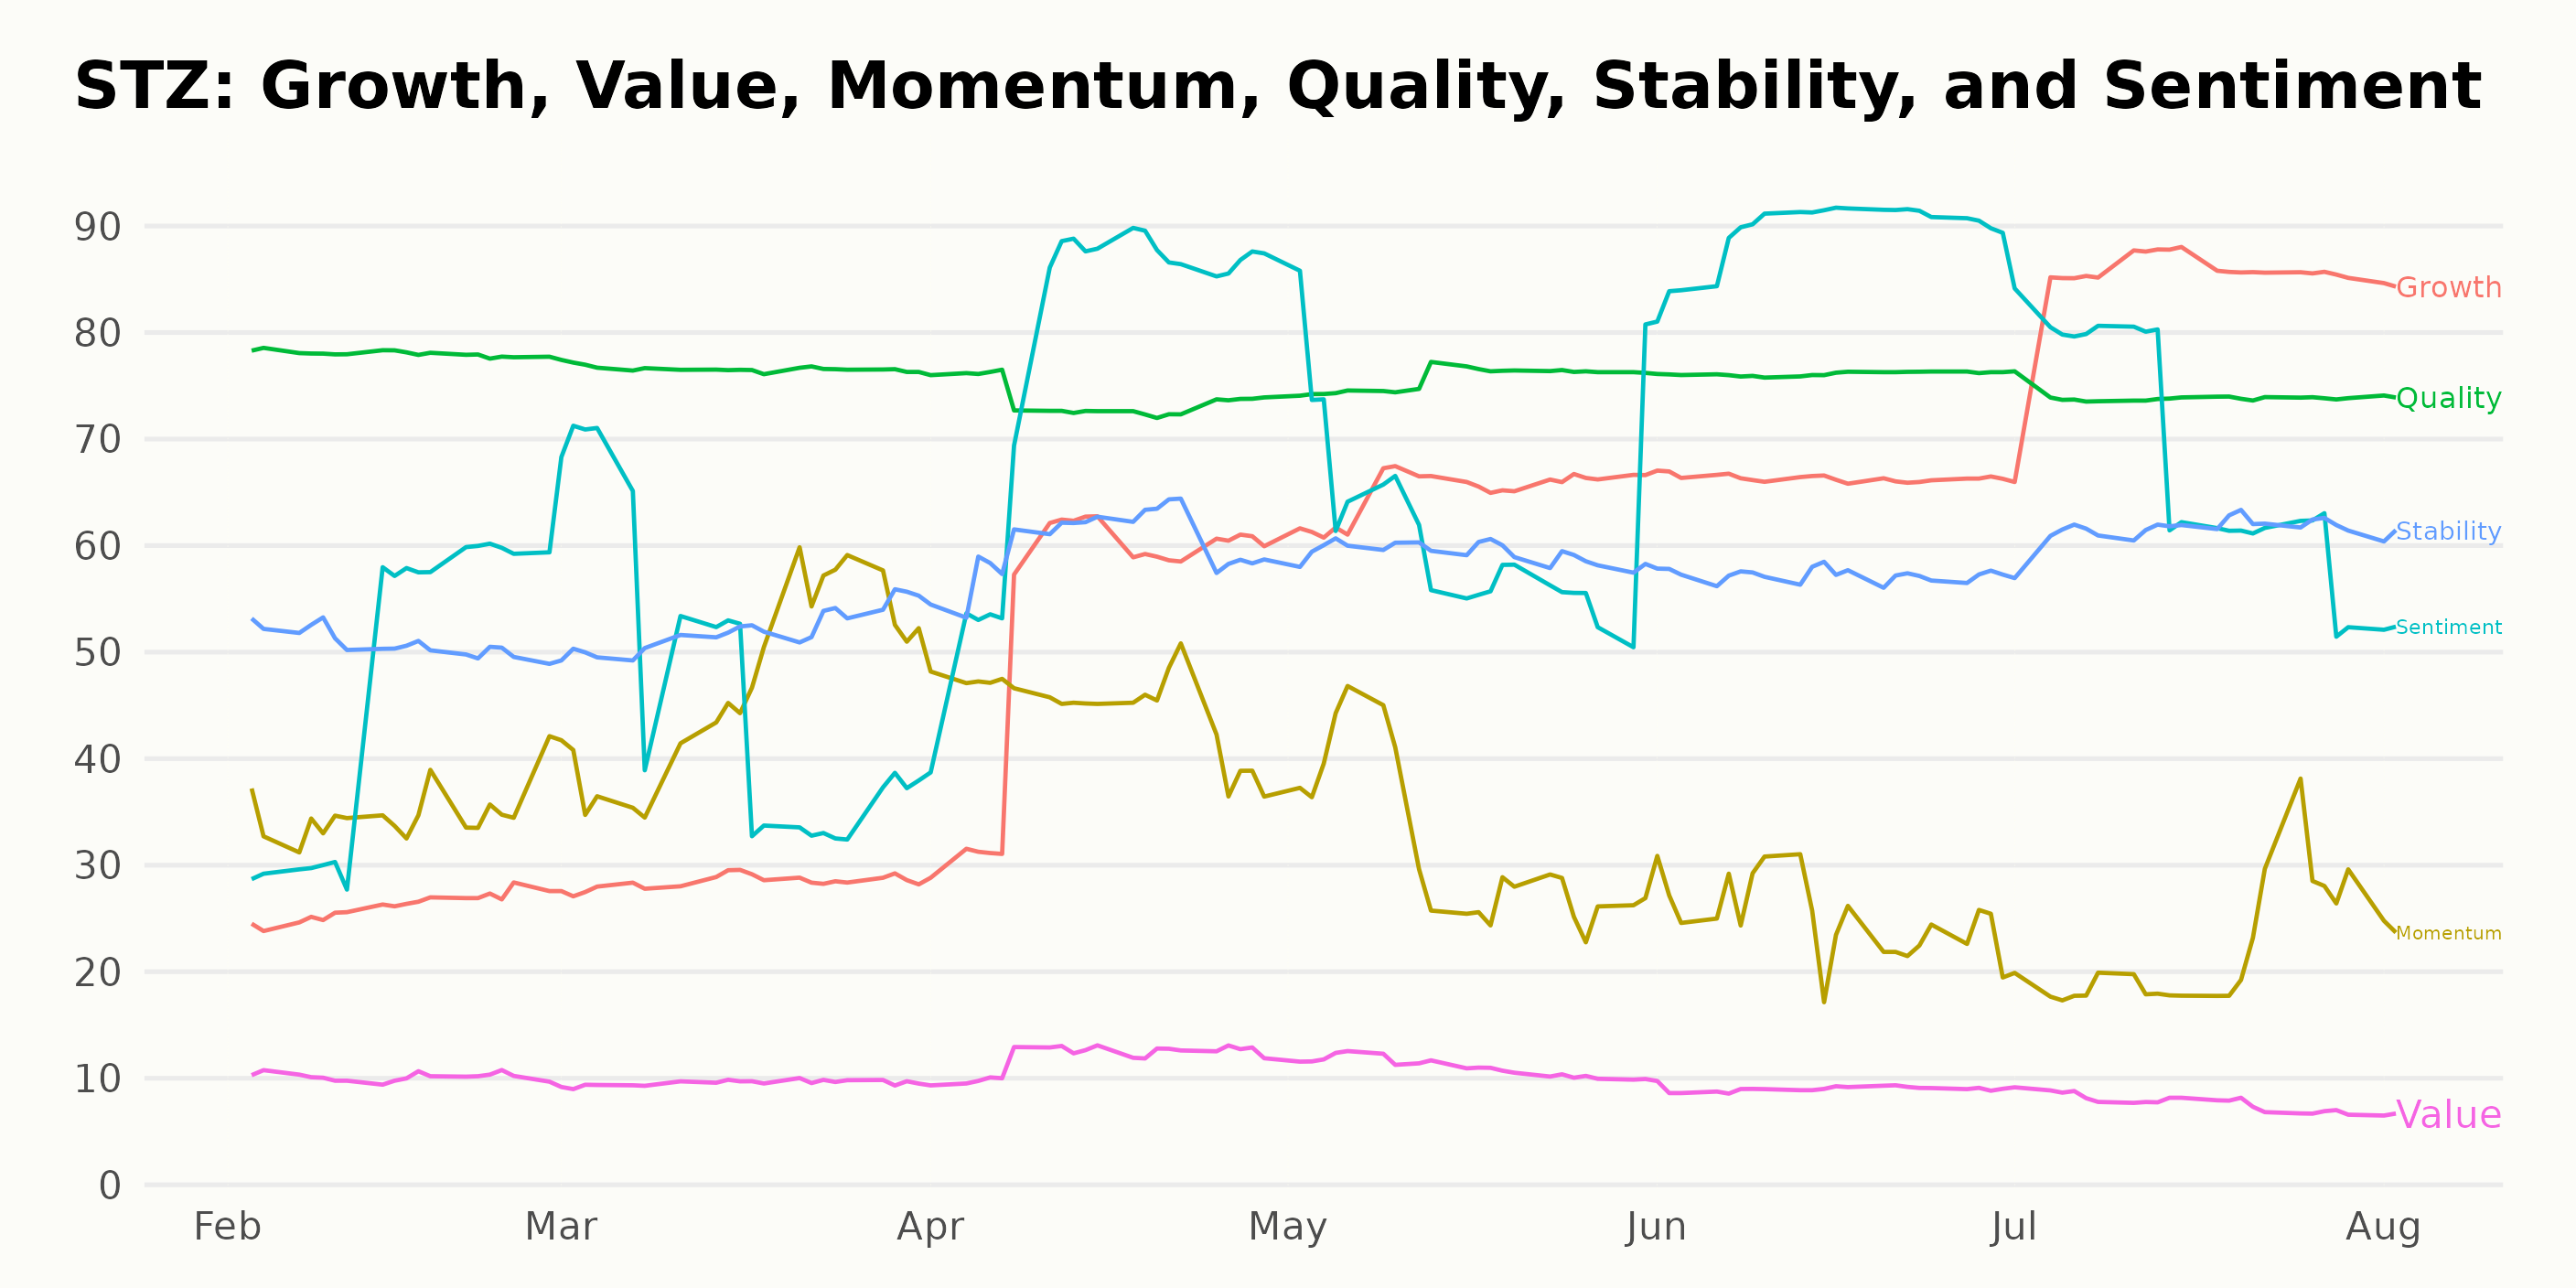
Assessing STZ’s POWR Ratings
STZ has an overall C rating, translating to a Neutral in our POWR Ratings system. It is ranked #25 out of the 37 stocks in the Beverages category.
Here is a concise breakdown of its performance over time:
- Its POWR Ratings remained steady at C over the course of several months from February 2023 to August 2023.
- In the ranking within its category, STZ started at 30 position as of February 4, 2023.
- The stock fluctuated between the 23 and 31 positions until July 22, 2023, when it managed to hold the 23 rank consistently for a week.
- However, by August 1, 2023, the rank deteriorated slightly to #26 spot.
How does Constellation Brands Inc. (STZ) Stack Up Against its Peers?
Other stocks in the Beverages sector that may be worth considering are Coca-Cola Bottling Co. Consolidated (COKE), Suntory Beverage & Food Ltd (STBFY), and Embotelladora Andina S.A. (AKO.B) -- they have better POWR Ratings.
43 Year Investment Pro Shares Top Picks
Steve Reitmeister is best known for his timely market outlooks & unique trading plans to stay on the right side of the market action. Click below to get his latest insights…
Steve Reitmeister’s Trading Plan & Top Picks >
STZ shares were trading at $271.05 per share on Wednesday afternoon, up $1.02 (+0.38%). Year-to-date, STZ has gained 17.82%, versus a 18.75% rise in the benchmark S&P 500 index during the same period.
About the Author: Kritika Sarmah

Her interest in risky instruments and passion for writing made Kritika an analyst and financial journalist. She earned her bachelor's degree in commerce and is currently pursuing the CFA program. With her fundamental approach, she aims to help investors identify untapped investment opportunities.
The post Is Constellation Brands (STZ) a Good Growth Stock to Watch in August? appeared first on StockNews.com