Commercial asset marketplace RB Global (NYSE: RBA) announced better-than-expected revenue in Q3 2026, with revenue up 16.6% year on year to $1.27 billion. Its non-GAAP profit of $1.03 per share was 3.3% above analysts’ consensus estimates.
For more on RB Global, read our full research report, available free.
RB Global (RBA) Q3 2026 highlights:
- Revenue $1.27 billion vs S&P analyst consensus of $1.18 billion (16.6% year-on-year growth, 7.6% beat)
- Adjusted EPS $1.03 vs S&P analyst consensus of $1.00 (3.3% beat)
- Adjusted EBITDA $370.9 million vs analysts’ consensus estimates of $354.9 million (29.1% margin, 4.5% beat)
- EBITDA guidance $1.54 billion at the midpoint for the full year, above analysts’ consensus estimates of $1.5 billion
- Operating margin 17%, up from 14.5% in the same quarter last year
- Free cash flow margin 15.4%, similar to the same quarter last year
- Market capitalization $17.32 billion
WESTCHESTER, Ill.--(BUSINESS WIRE)--RB Global, Inc. (NYSE & TSX: RBA, the “Company”, “RB Global”, “we”, “us”, or “our”) reported the following results for the three months ended September 30, 2026.
Revenue growth
Reviewing a company’s long-term revenue performance reveals insights into its quality. Even a weak business can perform well for one or two quarters, but a high-quality one grows for years. RB Global’s 28.4% annualized revenue growth over the last five years was strong. Its growth beat the average business services company and shows its offerings resonate with customers.
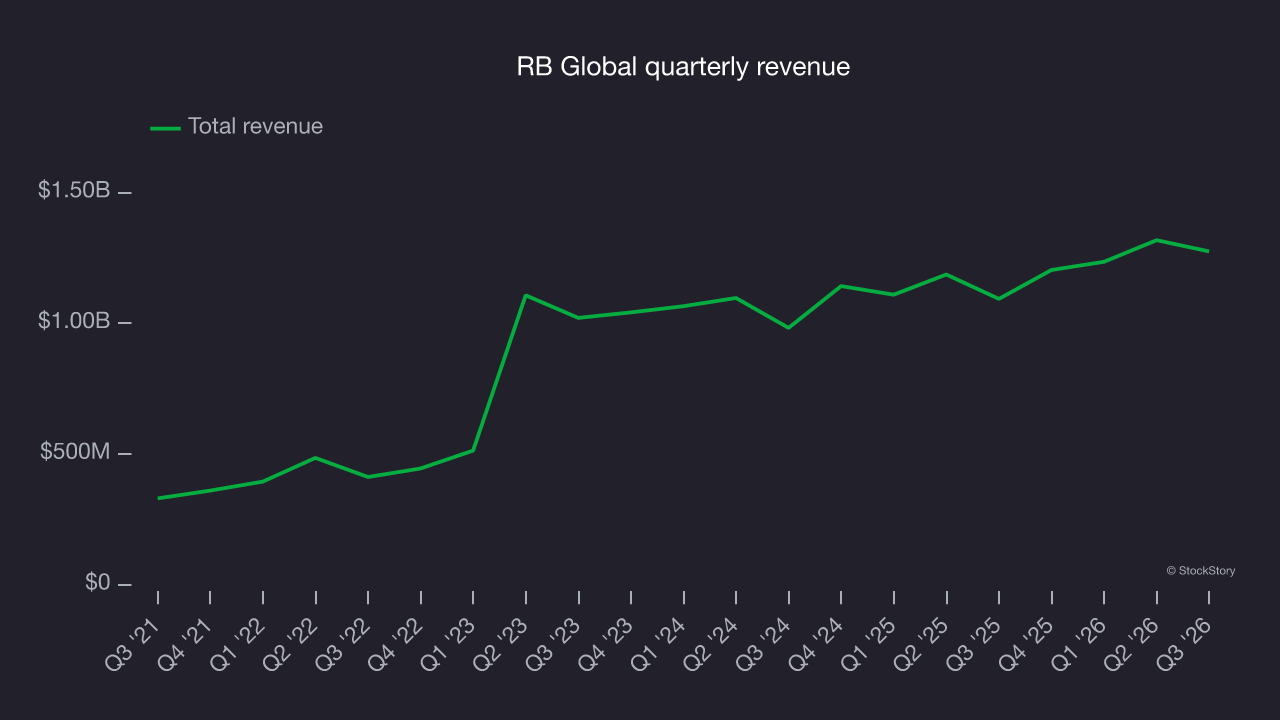
Long-term growth matters most, but within business services, a half-decade historical view may miss recent innovations or disruptive industry trends. RB Global’s annualized revenue growth of 9.6% over the last two years is below its five-year trend, but the results still suggest healthy demand. 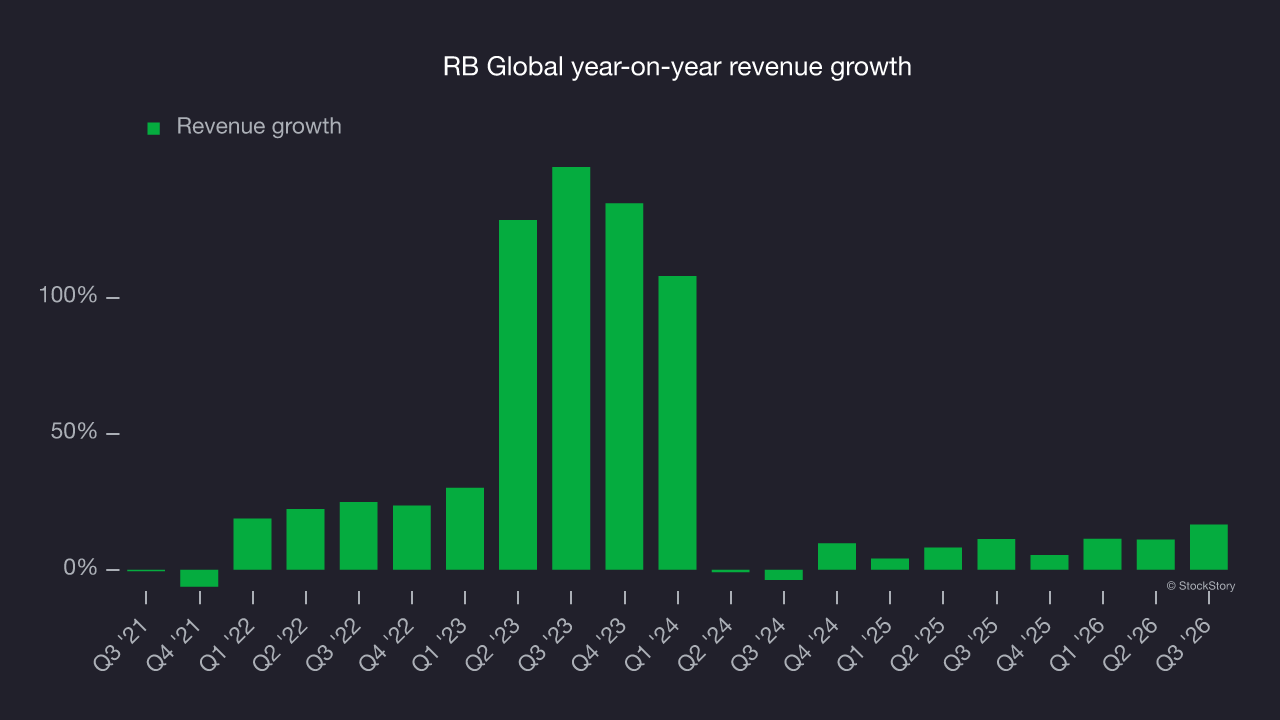
This quarter, RB Global reported year-on-year revenue growth of 16.6%, and its $1.27 billion of revenue exceeded Wall Street’s consensus estimates by 7.6%.
Looking ahead, sell-side analysts expect revenue to grow 4.1% over the next 12 months, according to S&P, a deceleration versus the last two years. This projection is underwhelming and indicates its products and services will face some demand challenges. Still, the company is performing well on other measures of financial health.
Adjusted operating margin
Adjusted operating margin is one of the best measures of profitability because it tells us how much money a company takes home after subtracting all core expenses, like marketing and R&D. It also removes various one-time costs to paint a better picture of normalized profits.
RB Global has performed well over the last five years. It demonstrated strong profitability for a business services company, with an average adjusted operating margin of 25.1%.
Looking at the trend in its profitability, RB Global’s adjusted operating margin rose by 1.7 percentage points over the last five years, as its revenue growth gave it operating leverage.
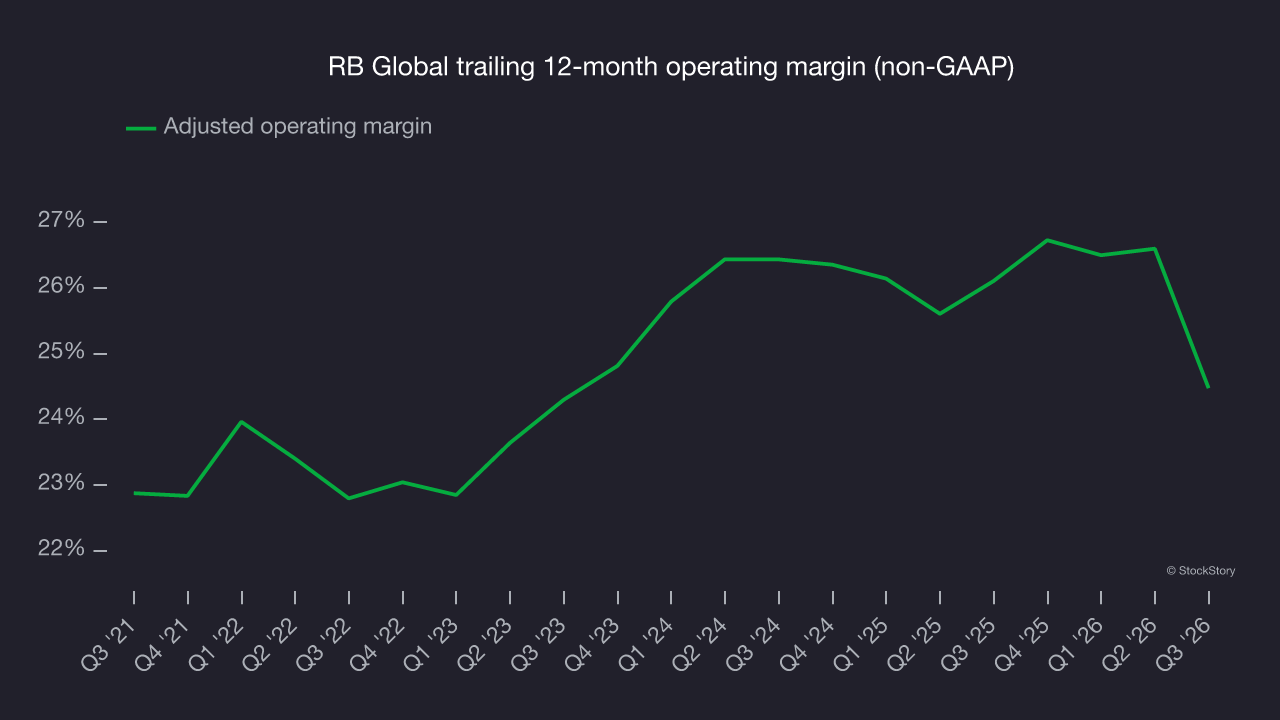
This quarter, RB Global generated an adjusted operating profit margin of 18.1%, down 8.4 percentage points year on year. This contraction shows it was less efficient because its expenses grew faster than its revenue.
Earnings per share
Revenue trends explain a company’s historical growth, but the long-term change in earnings per share (EPS) points to the profitability of that growth. For example, a company could inflate its revenue through excessive spending on advertising and promotions.
RB Global’s EPS grew at a strong 22.1% compounded annual growth rate over the last five years. Despite its adjusted operating margin improvement during that time, this performance trailed its 28.4% annualized revenue growth, indicating that non-fundamental factors such as interest and taxes affected its ultimate earnings.
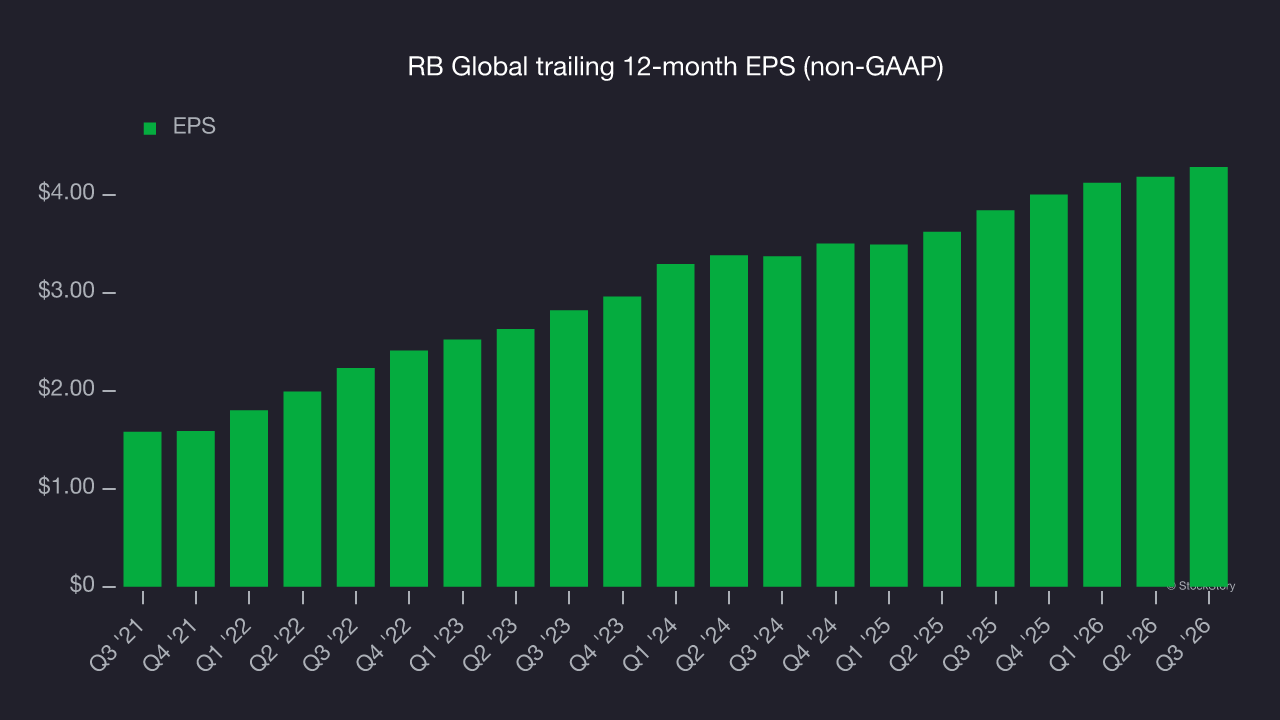
A closer look at RB Global’s earnings helps explain its performance. A five-year view shows RB Global has diluted its shareholders, growing its share count by 65.4%. This dilution overshadowed its increased operational efficiency and has led to lower per share earnings. Taxes and interest expenses can also affect EPS but don’t tell us as much about a company’s fundamentals. 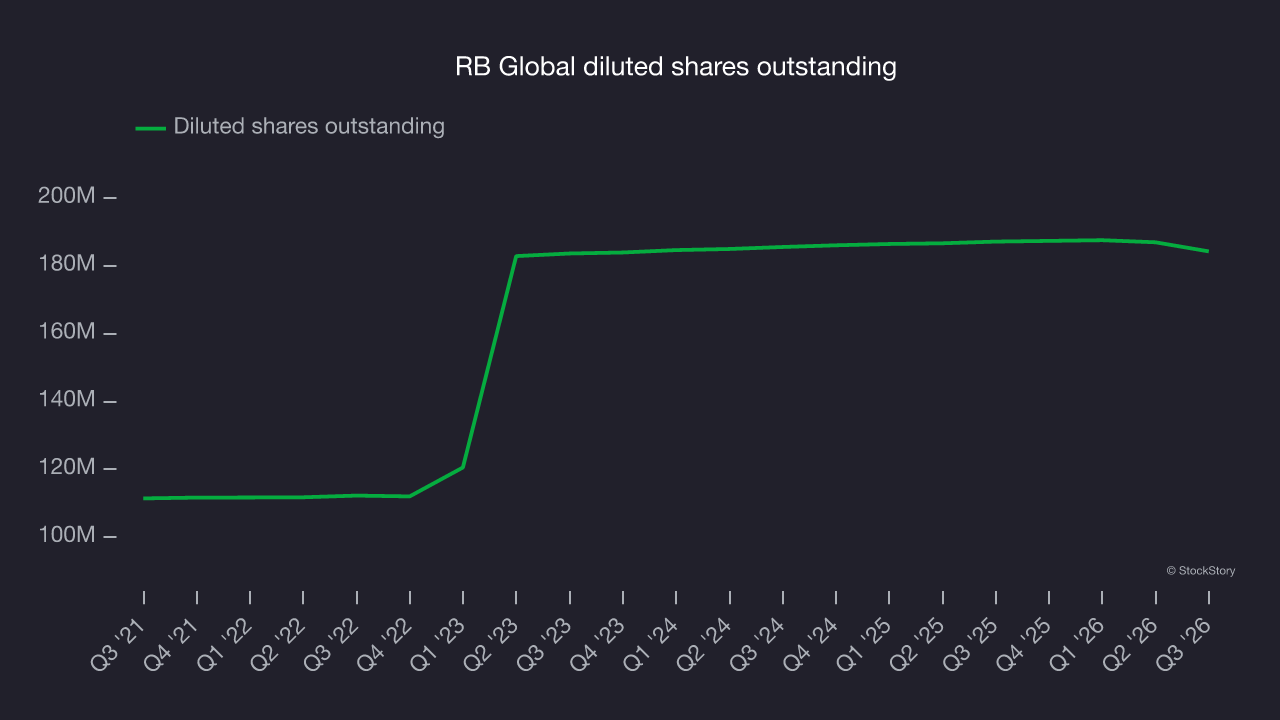
As with revenue, we analyze EPS over a shorter period to see if we are missing a change in the business.
For RB Global, its two-year annual EPS growth of 12.7% was lower than its five-year trend. Growth remained solid despite the slowdown.
In Q3, RB Global reported adjusted EPS of $1.03, up from $0.93 in the same quarter last year. This result beat analysts’ consensus estimates by 3.3%. Over the next 12 months, Wall Street expects RB Global’s full-year EPS to grow 11% from $4.28 to $4.75, according to S&P.
Key takeaways from RB Global’s Q3 results
Revenue came in well ahead of analysts’ consensus estimates, and EPS also topped Wall Street’s consensus, making this a solid quarter for RB Global. Shares rose 2.4% to $95.76 immediately after the results.
RB Global had a solid quarter, but an investment decision calls for a broader view. When making that decision, it’s important to consider its valuation, business quality and what has happened in the latest quarter. For more on these factors, read our full research report here (it’s free).