Commercial lighting and retail display solutions provider LSI (NASDAQ: LYTS) met Wall Street’s revenue expectations in calendar Q3 2026 (fiscal Q1 2027), with revenue up 43.6% year on year to $225.9 million. Its non-GAAP profit of $0.31 per share was in line with analysts’ consensus estimates.
For more on LSI, read our free full research report.
LSI (LYTS) Q3 CY2026 highlights:
- Revenue $225.9 million vs S&P analysts’ consensus estimates of $224.8 million (43.6% year-on-year growth, in line)
- Adjusted EPS $0.31 vs S&P analysts’ consensus estimates of $0.32 (in line)
- Adjusted EBITDA $22.17 million vs analysts’ consensus estimates of $22.82 million (9.8% margin, 2.9% miss)
- Operating margin 6.3%, in line with the same quarter last year
- Free cash flow $13.79 million, up from -$292,000 in the same quarter last year
- Market capitalization $773.9 million
“During the first quarter, we continued to advance the integration of Royston as we build a leading, retail branding solutions platform of scale across North America,” stated James A. Clark, President and CEO of LSI. “While cost inflation and elevated interest rates remain potential headwinds for non-residential construction activity, demand across our key vertical markets remains resilient early into fiscal 2027. We remain focused on expanding cross-selling opportunities across the combined LSI-Royston customers within our core refueling/c-store, grocery, and QSR markets, while continuing to scale a differentiated, one-stop solutions portfolio that is realizing a greater share of wallet across leading, multi-site retail chains. As we move forward executing the cross-selling opportunity afforded by the addition of Royston, our efforts combined to generate first quarter sales growth of 44%, increased adjusted EBITDA of 41%, and free cash flow of $13.8 million. We continue to see significant opportunities for driving improved operating leverage, consistent with our value-compounding business model.”
Revenue growth
Reviewing a company’s long-term revenue performance reveals insights into its quality. Any business can deliver a good quarter or two, but many enduring ones grow for years. LSI’s 16.6% annualized revenue growth over the last five years was strong. Its growth surpassed the average industrials company and shows its offerings resonate with customers.
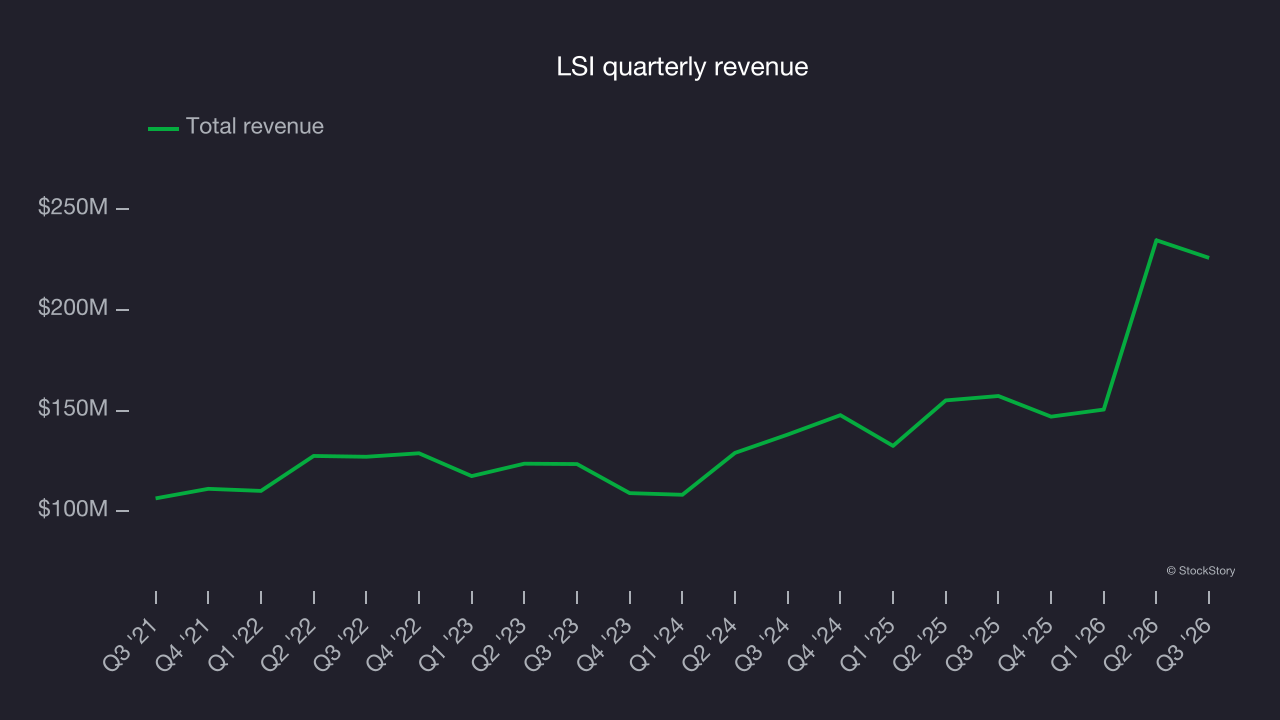
Long-term growth matters most, but within industrials, a half-decade historical view may miss cycles, industry trends or a company capitalizing on catalysts such as a new contract win or a successful product line. LSI’s annualized revenue growth of 25.1% over the last two years is above its five-year trend, suggesting its demand was strong and recently accelerated. 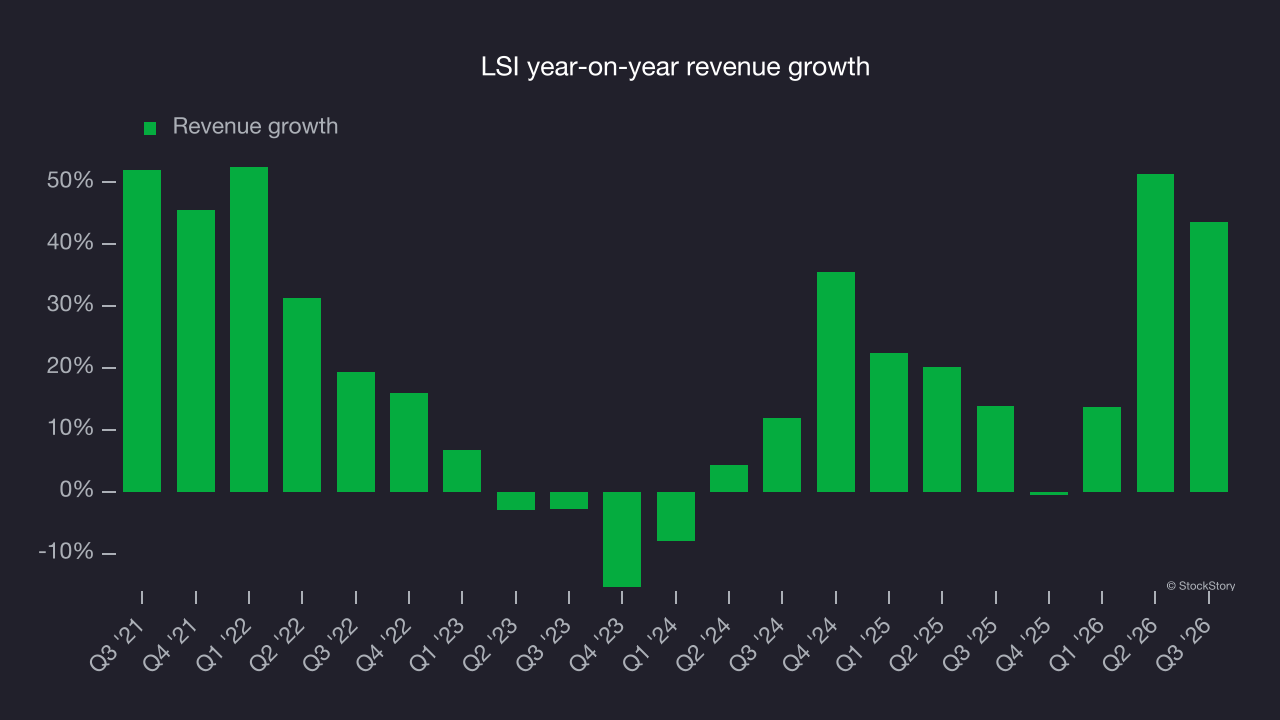
This quarter, LSI’s year-on-year revenue growth of 43.6% was strong, and its $225.9 million of revenue was in line with Wall Street’s consensus estimates.
Looking ahead, sell-side analysts expect revenue to grow 17.6% over the next 12 months, according to S&P, a deceleration versus the last two years. Still, this projection is noteworthy and suggests the market is forecasting success for its products and services.
Operating margin
Operating margin is an important measure of profitability as it shows the portion of revenue left after accounting for all core expenses, from the cost of goods sold to advertising and wages. It’s also useful for comparing profitability across companies with different levels of debt and tax rates because it excludes interest and taxes.
LSI was profitable over the last five years but held back by its large cost base. Its average operating margin of 6.8% was weak for an industrials business. That outcome is unsurprising given its low gross margin baseline.
On the positive side, LSI’s operating margin rose by 1.1 percentage points over the last five years, as its revenue growth provided operating leverage.
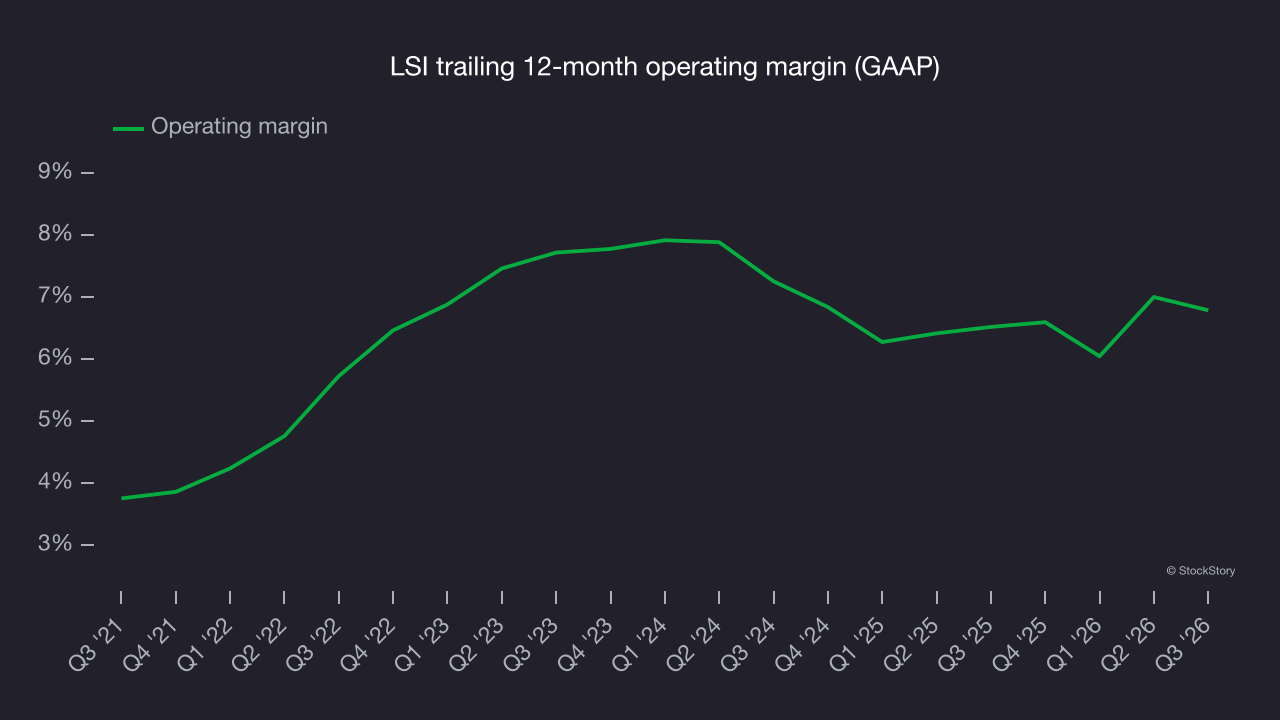
This quarter, LSI generated an operating margin of 6.3%, in line with the same quarter last year. This indicates the company’s cost structure has recently been stable.
Earnings per share
Revenue trends explain a company’s historical growth, but the long-term change in earnings per share (EPS) points to the profitability of that growth. For example, a company could inflate its revenue through excessive spending on advertising and promotions.
LSI’s EPS grew at a 25.8% compounded annual growth rate over the last five years, higher than its 16.6% annualized revenue growth. This indicates the company became more profitable on a per-share basis as it expanded.
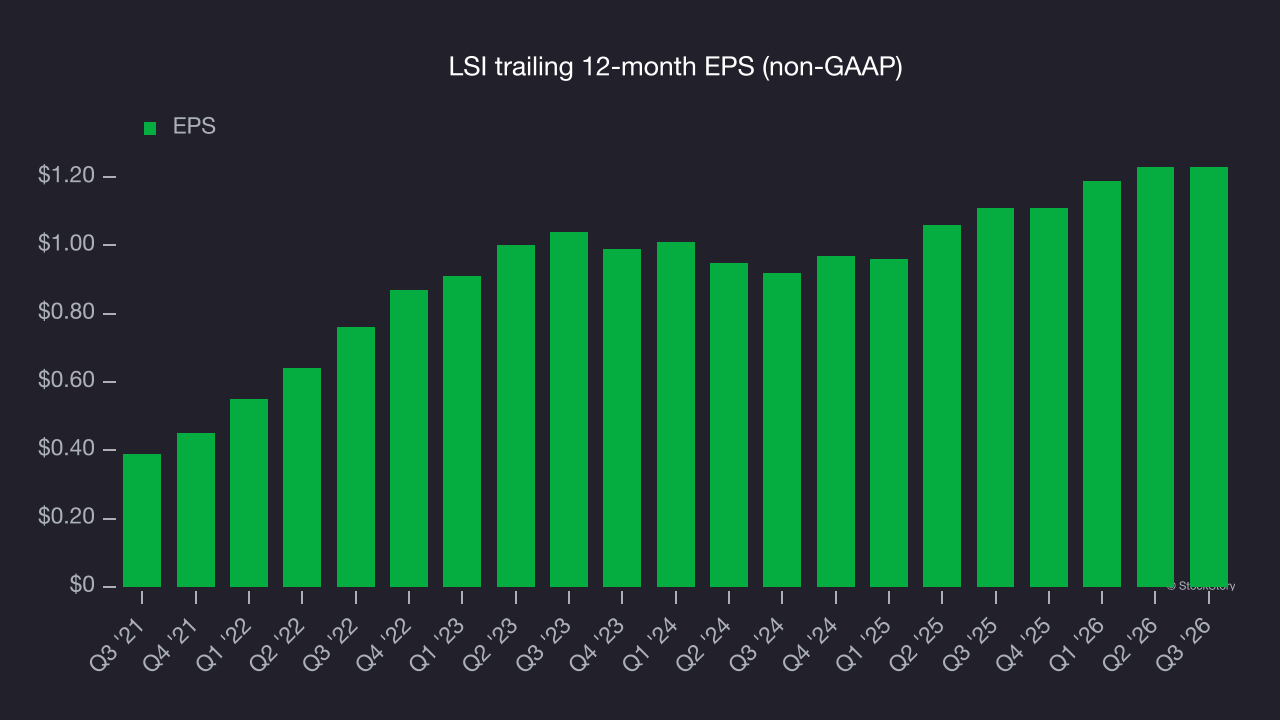
A closer look at LSI’s quality of earnings helps explain its performance. As mentioned earlier, LSI’s operating margin was flat this quarter but expanded by 1.1 percentage points over the last five years. This was the most relevant factor (aside from the revenue impact) behind its higher earnings; interest expenses and taxes can also affect EPS but reveal less about a company’s fundamentals.
As with revenue, analyzing EPS over a more recent period can provide insight into an emerging theme or development for the business.
For LSI, its two-year annual EPS growth of 15.6% was lower than its five-year trend. That was still a good pace, but faster growth would be welcome.
In Q3, LSI reported adjusted EPS of $0.31, in line with the same quarter last year. This result slightly missed analysts’ consensus estimates, but long-term adjusted EPS growth matters more than short-term movements. Over the next 12 months, Wall Street expects LSI’s full-year EPS to grow 17.1% from $1.23 to $1.44, according to S&P.
Key takeaways from LSI’s Q3 results
LSI’s EBITDA miss made for a weaker quarter, with revenue meeting analysts’ consensus expectations and EPS in line with Wall Street’s consensus estimates. Shares fell 4.3% to $20.46 immediately after the release.
LSI may have had a tough quarter, but does that create an investment opportunity? The latest quarter matters, but longer-term business quality and valuation matter more when deciding whether to invest in this stock. For more on LSI, read our full research report here (it’s free).