Aerospace and defense technology solutions provider Astronics Corporation (NASDAQ: ATRO) reported Q3 2026 results topping the market’s revenue expectations, with revenue up 28.5% year on year to $271.7 million. On the other hand, next quarter’s revenue guidance of $265 million was less impressive, coming in 3.2% below analysts’ consensus estimates. Its non-GAAP profit of $0.81 per share was 12.5% above analysts’ consensus estimates.
For more on Astronics, read our free full research report.
Astronics (ATRO) Q3 2026 highlights:
- Revenue $271.7 million vs S&P analysts’ consensus estimates of $268.1 million (28.5% year-on-year growth, 1.3% beat)
- Adjusted EPS $0.81 vs S&P analysts’ consensus estimates of $0.72 (12.5% beat)
- Adjusted EBITDA $59.35 million vs analysts’ consensus estimates of $53.46 million (21.8% margin, 11% beat)
- Revenue guidance $265 million at the midpoint for Q4 2026, below analysts’ consensus estimates of $273.7 million
- Operating margin 19.9%, up from 13.8% in the same quarter last year
- Free cash flow margin 8%, down from 9.9% in the same quarter last year
- Backlog $780 million at quarter end, up 20.6% year on year
- Market capitalization $2.53 billion
Peter J. Gundermann, Chairman, President and Chief Executive Officer, commented, “We delivered a strong third quarter, with record sales and operating income and an adjusted EBITDA margin near its all-time high. These results reflect disciplined operational execution and strong demand across our markets. Bookings were a solid $271.1 million following the prior quarter that had benefited from a couple of large program awards. We expect momentum to continue as we head into the final quarter of the year.”
Revenue growth
A company’s long-term revenue performance can indicate its overall quality. Any business can deliver a good quarter or two, but the best consistently grow over the long haul. Over the last five years, Astronics grew its revenue at a strong 17.7% compounded annual growth rate. Its growth surpassed the average industrials company and shows its offerings resonate with customers.
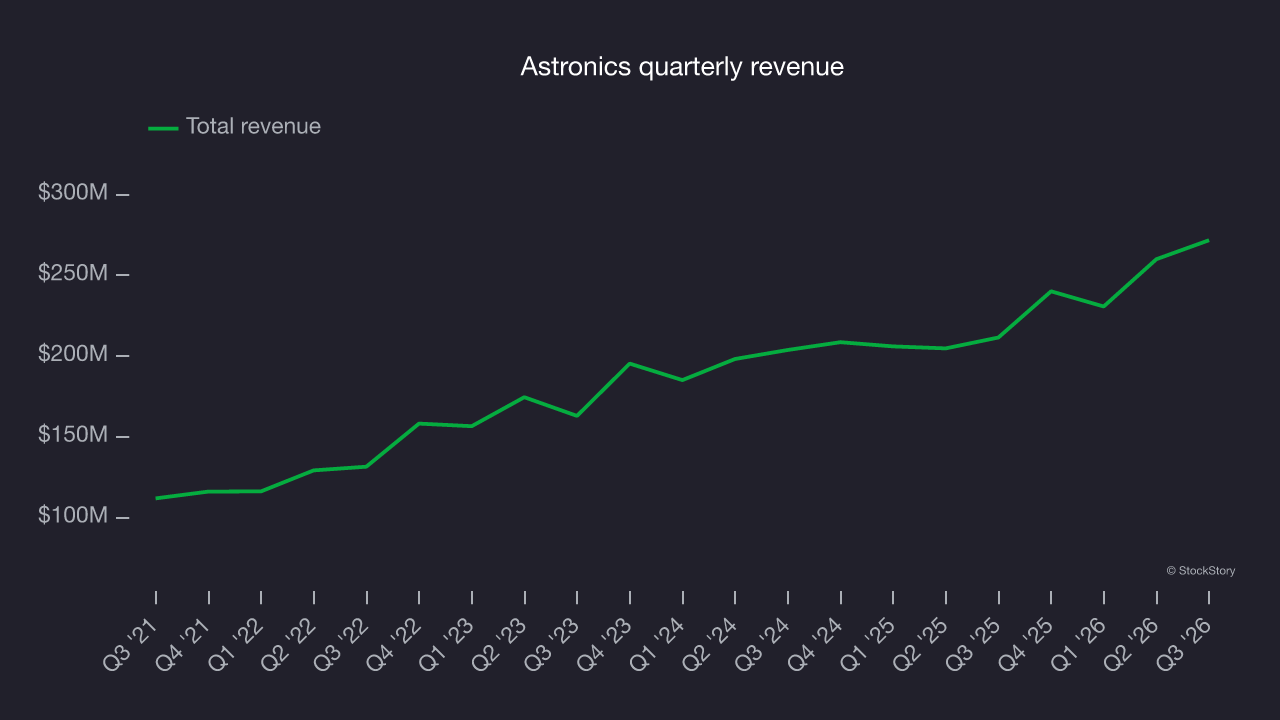
Long-term growth matters most, but within industrials, a half-decade historical view may miss cycles, industry trends or a company capitalizing on catalysts such as a new contract win or a successful product line. Astronics’s annualized revenue growth of 13.2% over the last two years is below its five-year trend, but the results still suggest healthy demand. 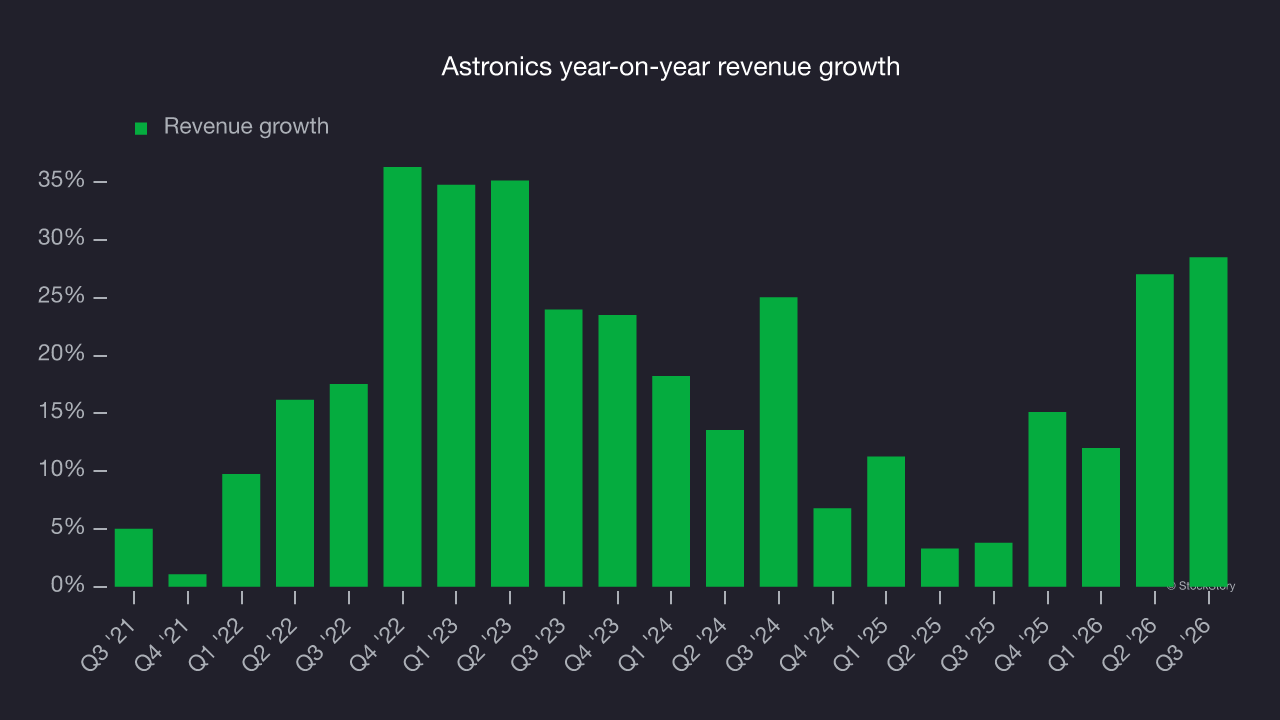
Backlog, or the value of outstanding orders that have not yet been executed or delivered, offers further insight into the company’s revenue dynamics. Astronics’s backlog reached $780 million in the latest quarter and averaged 13.8% year-on-year growth over the last two years. This growth was in line with revenue growth, indicating the company effectively balanced its new order intake and fulfillment processes. 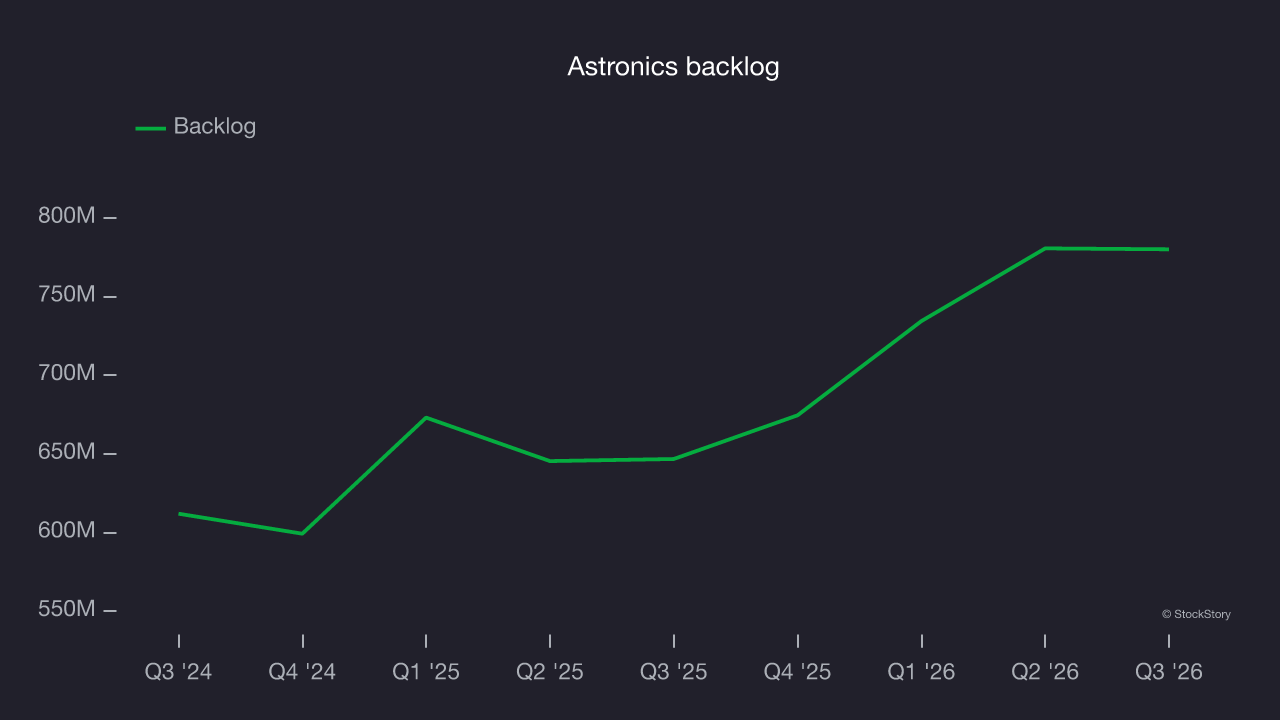
This quarter, Astronics reported year-on-year revenue growth of 28.5%, and its $271.7 million of revenue topped Wall Street’s consensus estimates by 1.3%. Management is guiding for a 10.4% year-on-year increase in revenue next quarter.
Looking further ahead, sell-side analysts expect revenue to grow 8.7% over the next 12 months, according to S&P, a deceleration versus the last two years. Despite the slowdown, this is a solid growth forecast and implies the market sees success for its products and services.
Operating margin
Operating margin is an important measure of profitability as it shows the portion of revenue left after accounting for all core expenses, from the cost of goods sold to advertising and wages. It’s also useful for comparing profitability across companies with different levels of debt and tax rates because it excludes interest and taxes.
Over the last five years, Astronics’s operating margin rose by 26.9 percentage points. This improvement shows its costs declined relative to revenue. Its trailing 12-month operating margin was 16.2%.
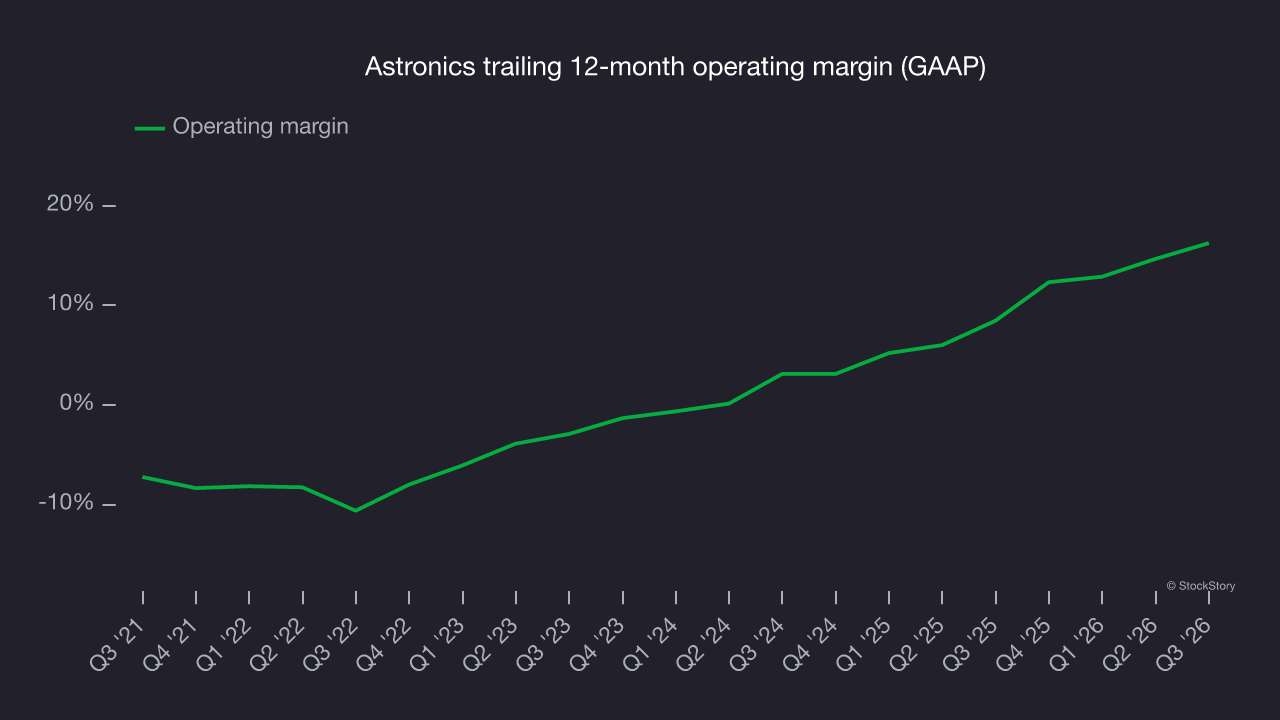
In Q3, Astronics generated an operating profit margin of 19.9%, up 6 percentage points year on year. This increase was a positive development and shows it was more efficient.
Earnings per share
Revenue trends explain a company’s historical growth, but the long-term change in earnings per share (EPS) points to the profitability of that growth. For example, a company could inflate its revenue through excessive spending on advertising and promotions.
Astronics’s full-year EPS turned positive over the last five years. This is a positive sign and shows it’s at an inflection point.
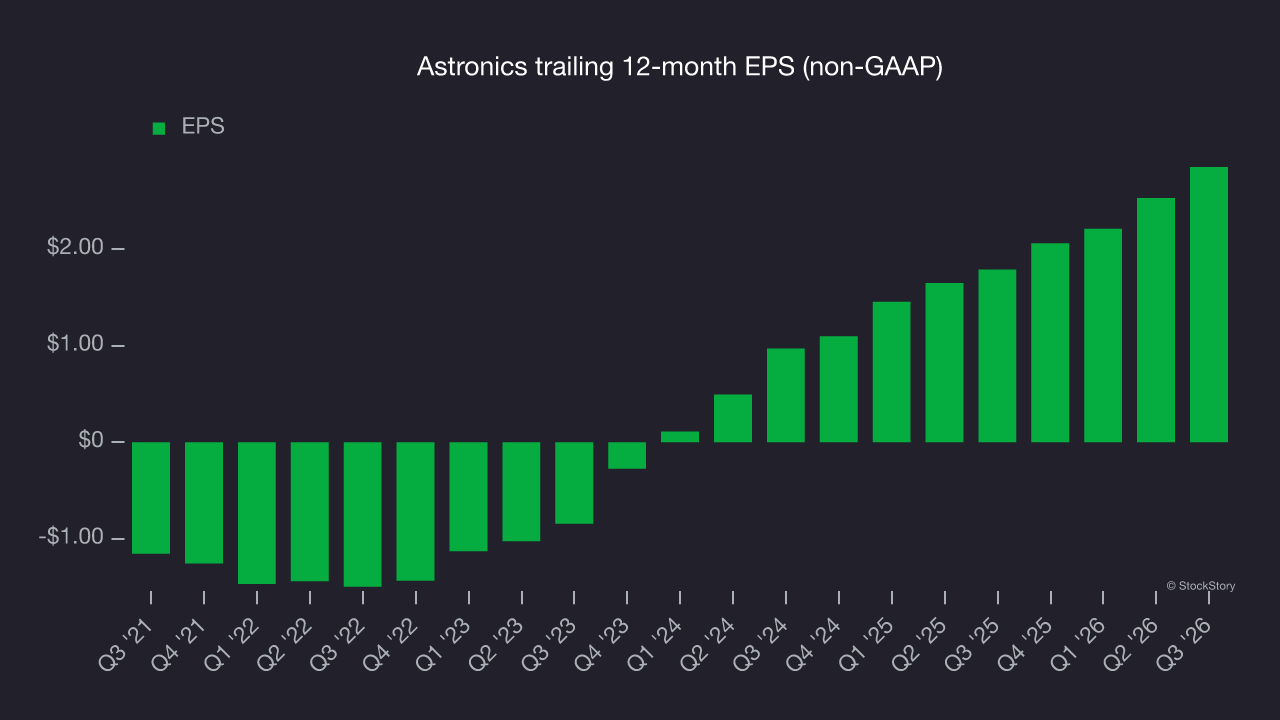
Like with revenue, we analyze EPS over a more recent period because it can provide insight into an emerging theme or development for the business.
Astronics’s EPS grew at a 71.2% compounded annual growth rate over the last two years, higher than its 13.2% annualized revenue growth. This indicates the company became more profitable on a per-share basis as it expanded.
Diving into Astronics’s quality of earnings can give us a better understanding of its performance. Astronics’s operating margin has expanded over the last two years. This was the most relevant factor (aside from the revenue impact) behind its higher earnings; interest expenses and taxes can also affect EPS but don’t tell us as much about a company’s fundamentals.
In Q3, Astronics reported adjusted EPS of $0.81, up from $0.49 in the same quarter last year. This result came in well above analysts’ consensus estimates. Over the next 12 months, Wall Street expects Astronics’s full-year EPS to grow 1.9% from $2.85 to $2.91, according to S&P.
Key takeaways from Astronics’s Q3 results
Astronics delivered a mixed quarter with some key positives: EBITDA came in well ahead of analysts’ consensus estimates, and EPS also topped Wall Street’s consensus. The revenue outlook was less encouraging, with guidance for next quarter missing consensus and the full-year forecast in line with expectations. Investors were likely hoping for more, and shares plunged 12.7% to $54.13 immediately after the report.
Astronics’ latest quarter matters, but longer-term business quality and valuation matter more when deciding whether to invest at the current price. Read the full research report here (it’s free).