Investment management firm T. Rowe Price (NASDAQ: TROW) announced better-than-expected revenue in Q3 2026, with revenue rising 5.1% year on year to $2.00 billion. Its non-GAAP profit of $2.86 per share was 7.9% above analysts’ consensus estimates.
For more on T. Rowe Price, read the free full research report.
T. Rowe Price (TROW) Q3 2026 highlights:
- Assets under management $1.9 trillion vs analysts’ consensus estimates of $1.87 trillion (7.5% year-on-year growth, 1.6% beat)
- Revenue $2.00 billion vs S&P analysts’ consensus estimates of $1.98 billion (5.1% year-on-year growth, 1.3% beat)
- Pre-tax profit $787.4 million (39.3% margin)
- Adjusted EPS $2.86 vs S&P analysts’ consensus estimates of $2.65 (7.9% beat)
- Market capitalization $22.18 billion
Revenue growth
Examining a company’s long-term performance can provide clues about its quality. Even a bad business can perform well for one or two quarters, but a top-tier one grows for years. T. Rowe Price struggled to consistently increase demand as its $7.72 billion of revenue for the trailing 12 months was close to its revenue five years ago. That underwhelming result suggests it’s a low-quality business.
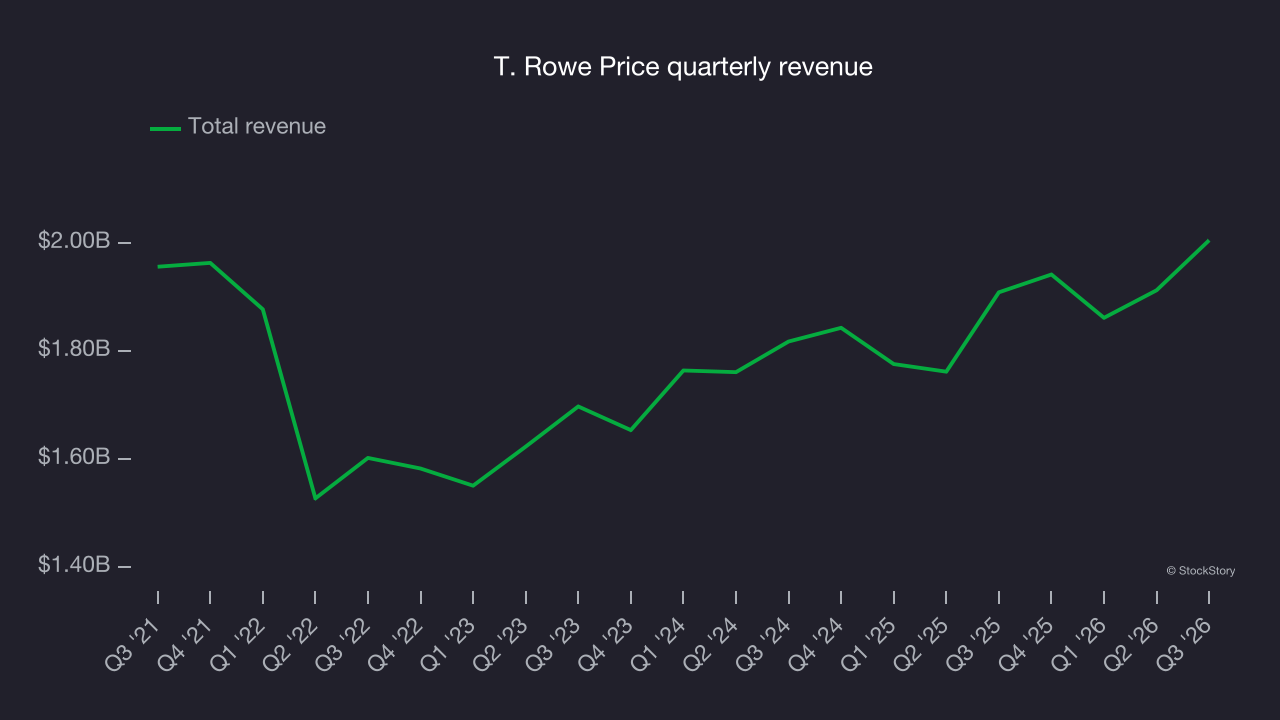
Long-term growth matters most, but within financials, a half-decade historical view may miss recent interest rate changes, market returns and industry trends. T. Rowe Price’s annualized revenue growth of 5.1% over the last two years is above its five-year trend, a positive sign. 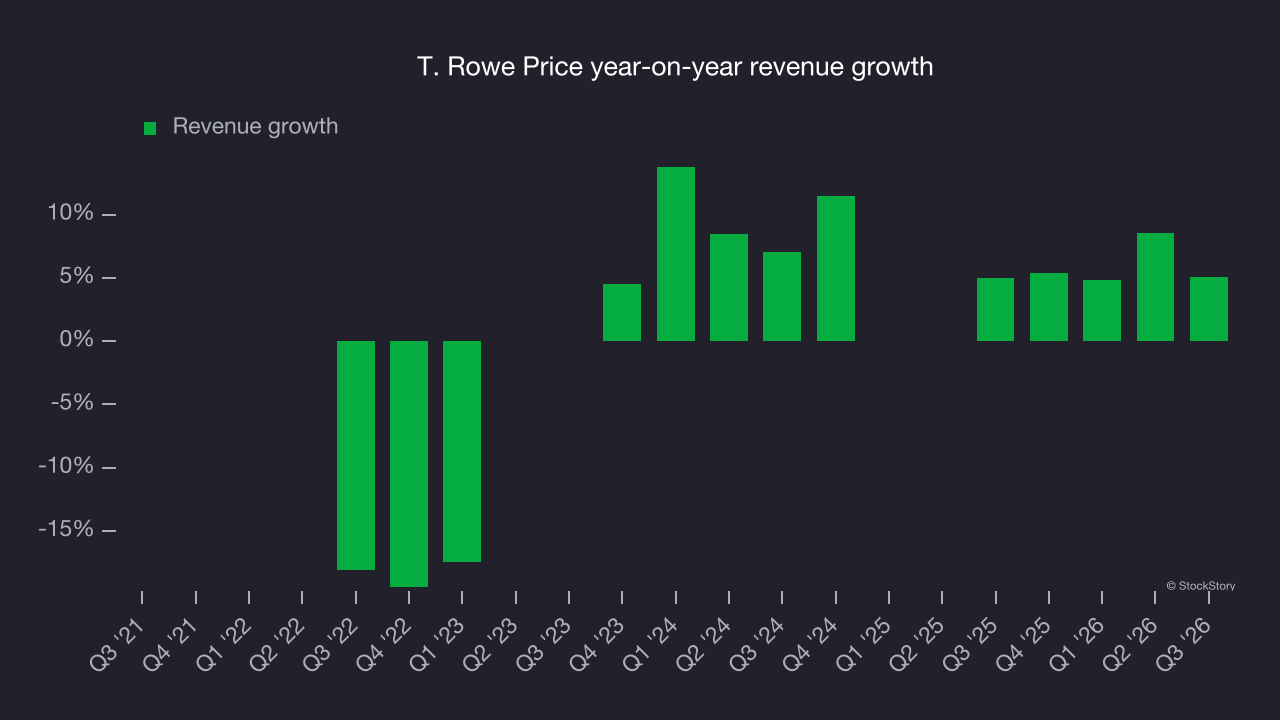 Note: Quarters not shown were determined to be outliers because they were impacted by outsized investment gains/losses that are not indicative of the recurring fundamentals of the business.
This quarter, T. Rowe Price reported year-on-year revenue growth of 5.1%, and its $2.00 billion of revenue exceeded Wall Street’s consensus estimates by 1.3%.
Assets under management (AUM)
Assets under management (AUM) is the total capital a firm oversees or manages on behalf of clients. Fees on this AUM, typically a small percentage, are contractually recurring and provide a high level of stability to revenue even if investment performance lags (although sufficiently poor investment performance eventually hurts fundraising ability).
T. Rowe Price’s AUM has grown at an annual rate of 3.2% over the last five years, worse than the broader financials industry but faster than its total revenue. Over the last two years, AUM growth accelerated to 8.5% annually. Fundraising or short-term investment performance was a net contributor for the company over this shorter period since assets grew faster than total revenue. Still, asset growth carries less weight given how lumpy and cyclical it can be.
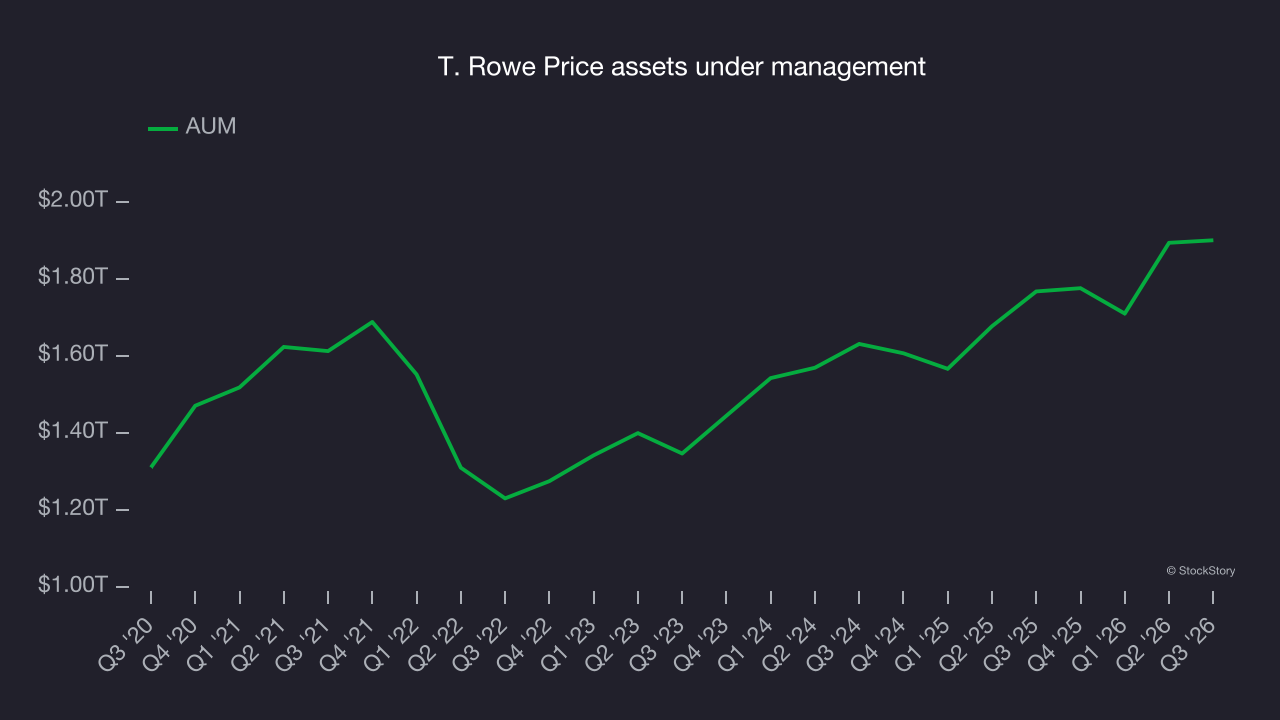
T. Rowe Price’s AUM came in at $1.9 trillion this quarter, beating analysts’ consensus estimates by 1.6%. AUM was 7.5% higher than the same quarter last year.
Key takeaways from T. Rowe Price’s Q3 results
T. Rowe Price delivered a strong quarter, with both AUM and EPS beating analysts’ consensus estimates. Shares rose 3.7% to $107.86 immediately after the results.
T. Rowe Price may have had a good quarter, but that alone does not make the stock a buy. That decision should take into account valuation, business quality and the latest earnings. For more on those considerations, read the full research report here (it’s free).