HR outsourcing provider Insperity (NYSE: NSP) reported Q3 2026 results exceeding the market’s revenue expectations, with revenue up 1.7% year on year to $1.65 billion. Its non-GAAP profit of $0.22 per share was in line with analysts’ consensus estimates.
For more on Insperity, read our free full research report.
Insperity (NSP) Q3 2026 highlights:
- Revenue $1.65 billion vs S&P analysts’ consensus estimates of $1.64 billion (1.7% year-on-year growth, 1% beat)
- Adjusted EPS $0.22 vs S&P analysts’ consensus estimates of $0.21 (in line)
- Adjusted EBITDA $31 million vs analysts’ consensus estimates of $30.1 million (1.9% margin, 3% beat)
- Adjusted EPS guidance Management lowered its full-year adjusted EPS guidance to $2.11 at the midpoint, a 2.3% decrease
- EBITDA guidance $204 million at the midpoint for the full year, above analysts’ consensus estimates of $201 million
- Operating margin -0.1%, up from -1.5% in the same quarter last year
- Market capitalization $1.97 billion
“We delivered solid third-quarter financial results reflecting continued progress on our top priority of margin recovery, achieving a meaningful step towards restoring the earnings power of our business model,” said Paul J. Sarvadi, Insperity chairman and chief executive officer. “Looking forward, we believe AI has the potential to strengthen demand for Insperity’s comprehensive HR solutions as small and midsize businesses navigate this transformation. Our strategy combines the power of AI with the experience of our HR professionals to help our client businesses succeed, further strengthen our offering and deepen client relationships, which we believe will drive long-term growth and shareholder value.”
Revenue growth
A company’s long-term revenue performance can indicate its overall quality. Any business can report a good quarter or two, but the best consistently grow over the long term.
With $6.9 billion in revenue over the past 12 months, Insperity is one of the larger companies in the business services industry and benefits from a well-known brand that influences purchasing decisions.
Insperity grew its revenue at a solid 7.8% compounded annual growth rate over the last five years. This shows it had high demand.
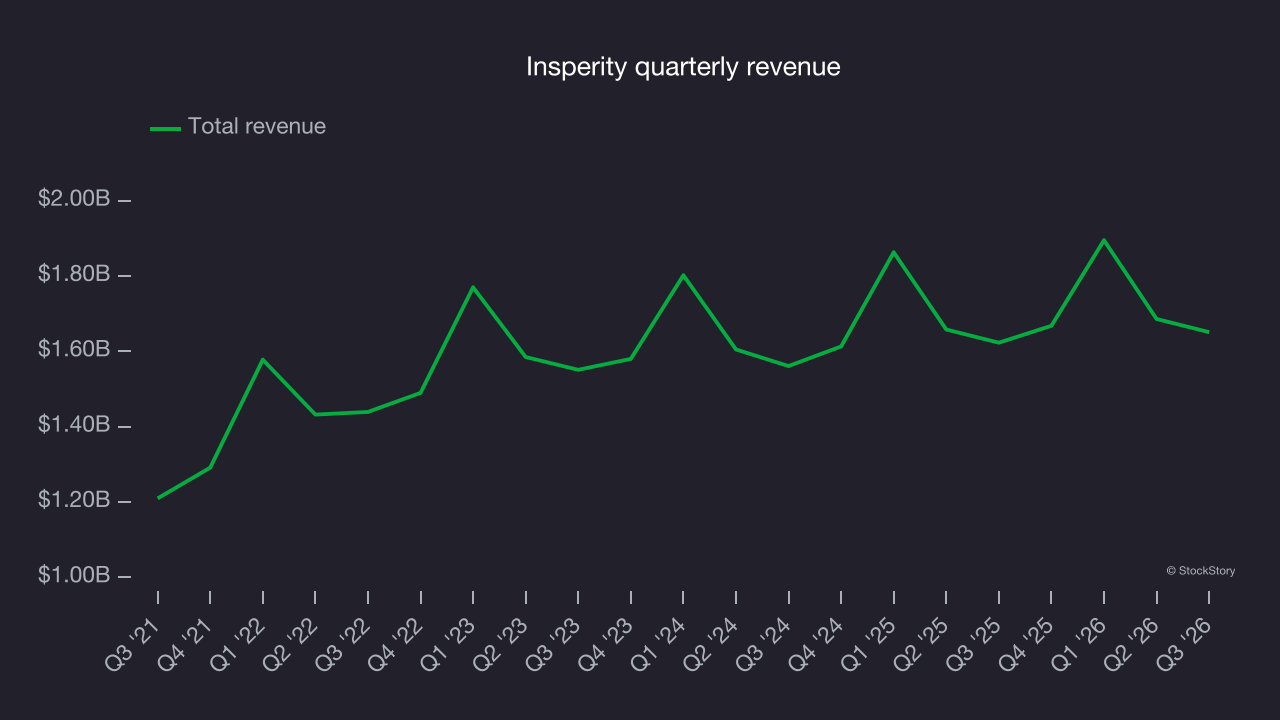
Long-term growth matters most, but within business services, a half-decade historical view may miss recent innovations or disruptive industry trends. Insperity’s recent performance shows its demand has slowed as its annualized revenue growth of 2.7% over the last two years was below its five-year trend. Decelerating revenue growth in the sector warrants caution, as it could signal changing consumer tastes aided by low switching costs. 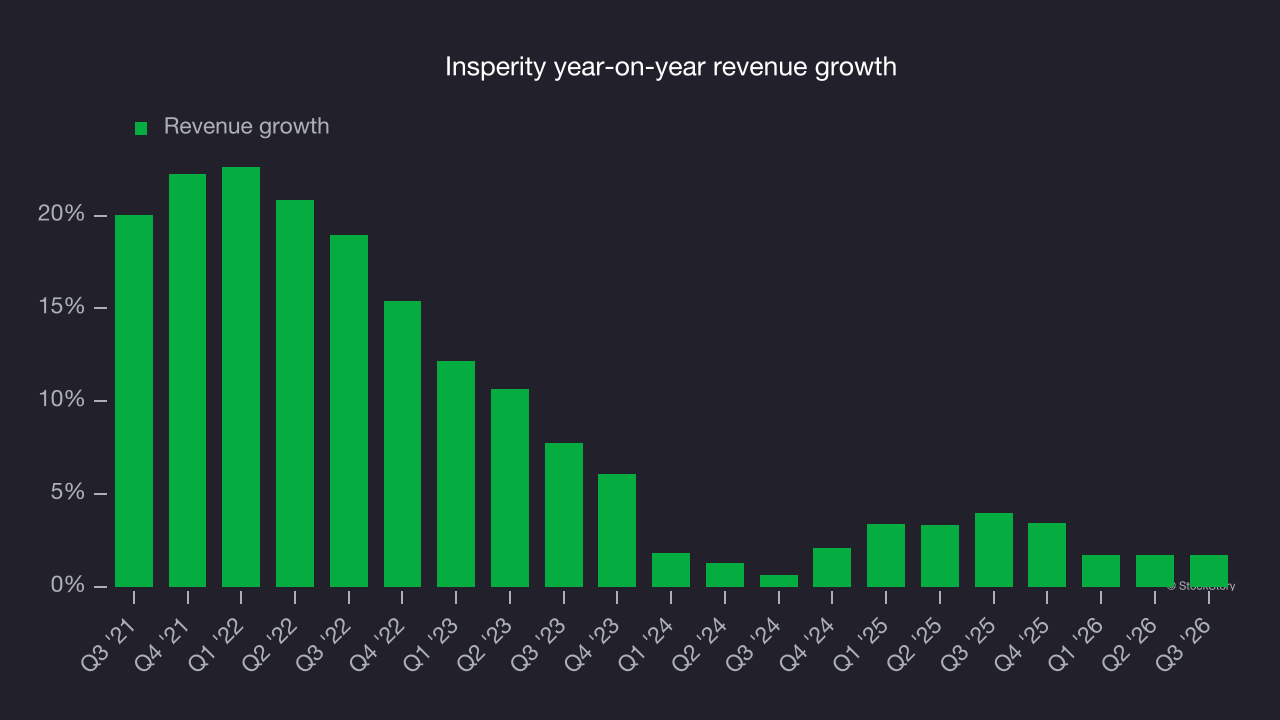
This quarter, Insperity reported modest year-on-year revenue growth of 1.7% but beat Wall Street’s consensus estimates by 1%.
Looking ahead, sell-side analysts expect revenue to grow 3.2% over the next 12 months, according to S&P, similar to its two-year rate. This uninspiring projection indicates its newer products and services will not yet drive better revenue performance.
Adjusted operating margin
Insperity was profitable over the last five years but held back by its large cost base. Its average adjusted operating margin of 2.8% was weak for a business services company.
Insperity’s adjusted operating margin decreased by 3.6 percentage points over the last five years. This raises questions about the company’s expense base because its revenue growth should have given it leverage on its fixed costs, resulting in better economies of scale and profitability. Insperity’s poor performance shows that costs were rising and it couldn’t pass them on to its customers.
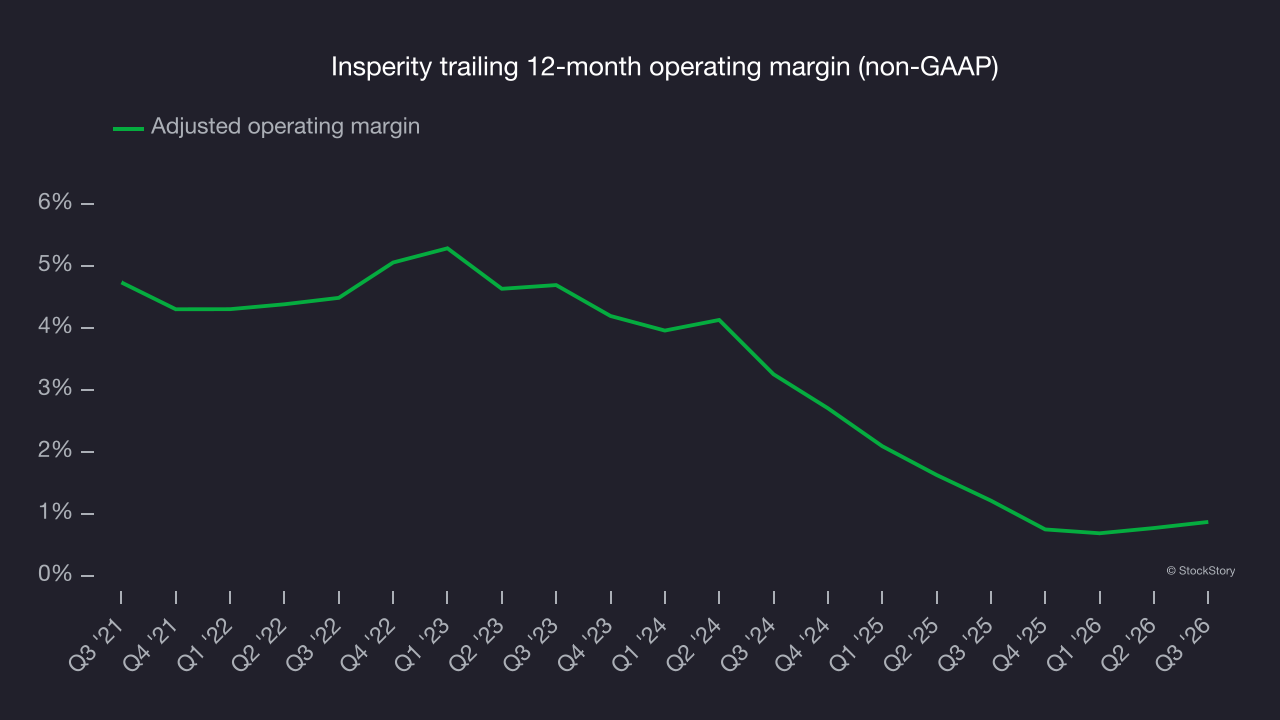
This quarter, Insperity’s breakeven margin was -0.1%, in line with the same quarter last year. This indicates the company’s overall cost structure has been relatively stable.
Earnings per share
We track the long-term change in earnings per share (EPS) for the same reason as long-term revenue growth. Compared to revenue, however, EPS highlights whether a company’s growth is profitable.
Insperity’s EPS declined by 20.9% annually over the last five years while its revenue grew by 7.8%. This indicates the company became less profitable on a per-share basis as it expanded.
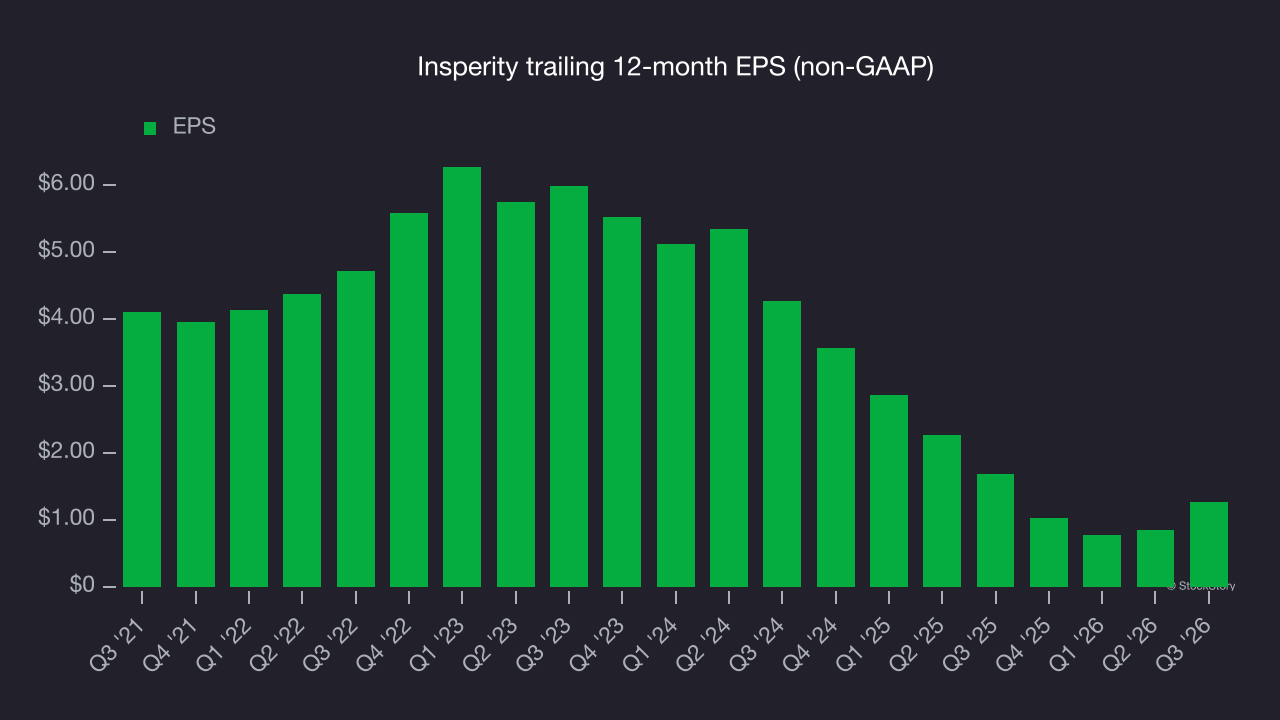
We can take a deeper look into Insperity’s earnings to better understand the drivers of its performance. As we mentioned earlier, Insperity’s adjusted operating margin was flat this quarter but declined by 3.6 percentage points over the last five years. Its share count also grew by 28.6%, meaning the company not only became less efficient with its operating expenses but also diluted its shareholders. 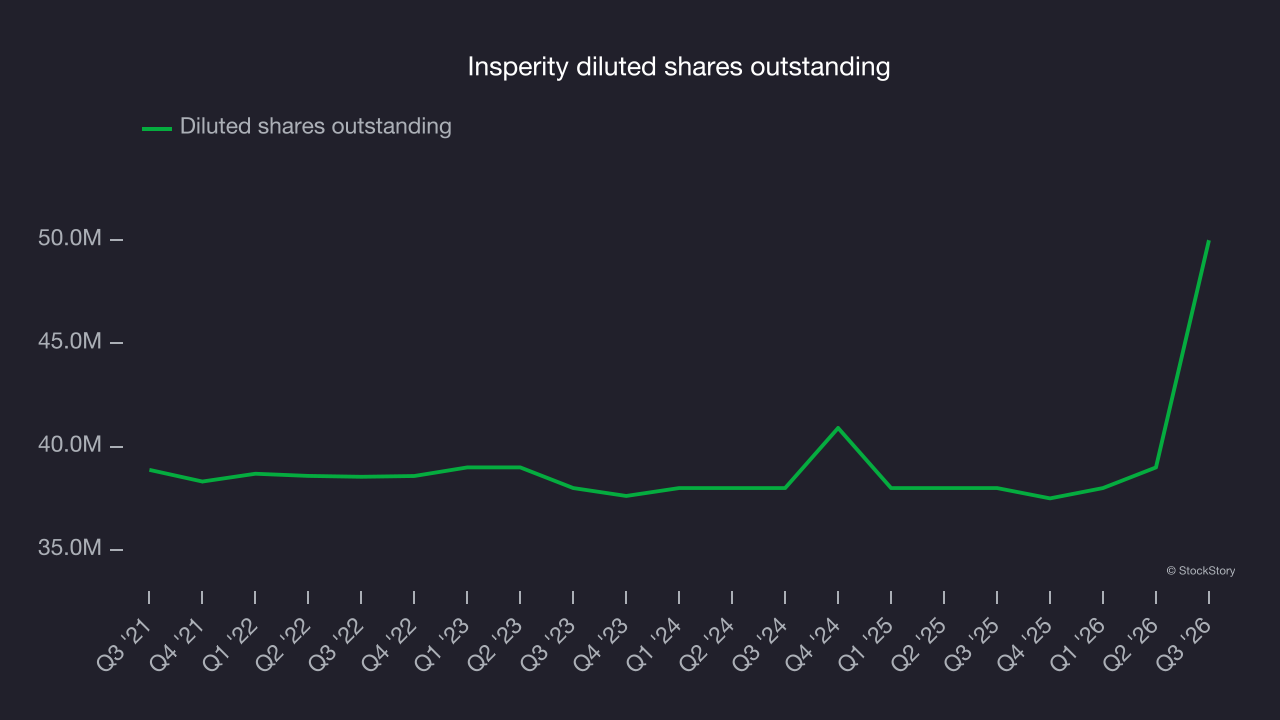
Like with revenue, we analyze EPS over a more recent period because it can provide insight into an emerging theme or development for the business.
For Insperity, its two-year annual EPS declines of 45.5% show it’s continued to underperform. These were poor results.
In Q3, Insperity’s adjusted EPS rose to $0.22 from negative $0.20 in the same quarter last year, beating analysts’ consensus estimates by 3.1%. Over the next 12 months, Wall Street expects Insperity’s full-year EPS to grow 97.9% from $1.27 to $2.51, according to S&P.
Key takeaways from Insperity’s Q3 results
Insperity’s outlook left room for improvement: next-quarter EPS guidance missed consensus estimates, and full-year EPS guidance was in line with Wall Street’s consensus. The quarter itself offered some positives, with revenue narrowly beating Wall Street’s consensus estimates and EPS meeting analysts’ consensus estimates. Taken together, the results could have been better. Shares fell 2.4% to $50.43 immediately after the report.
Insperity underperformed this quarter, but what does that mean for its investment outlook? If you’re making that decision, you should consider valuation, business quality and the latest earnings. Read our full research report here (it’s free).