Timeshare vacation company Hilton Grand Vacations (NYSE: HGV) beat Wall Street’s revenue expectations in Q3 2026, with revenue up 50.8% year on year to $1.96 billion. Its non-GAAP profit of $4.03 per share was significantly above analysts’ consensus estimates. Revenue and EPS both benefited significantly by a one-time net construction recognition charge in the quarter (details below).
For more on Hilton Grand Vacations, read the free full research report.
Hilton Grand Vacations (HGV) Q3 2026 highlights:
- Revenue $1.96 billion vs S&P analysts’ estimates of $1.41 billion (50.8% year-on-year growth, 39.5% beat).
- Revenue was helped by a non-recurring $536M one-time net construction recognition in the quarter.
- Adjusted EPS $4.03 vs S&P analysts’ estimates of $1.11 (significant beat).
- EPS was helped by a one-time $3.76 net construction recognition in the quarter.
- Adjusted EBITDA $617 million vs analyst estimates of $297.9 million (31.5% margin, significant beat)
- Free cash flow margin 2.7%, similar to the same quarter last year
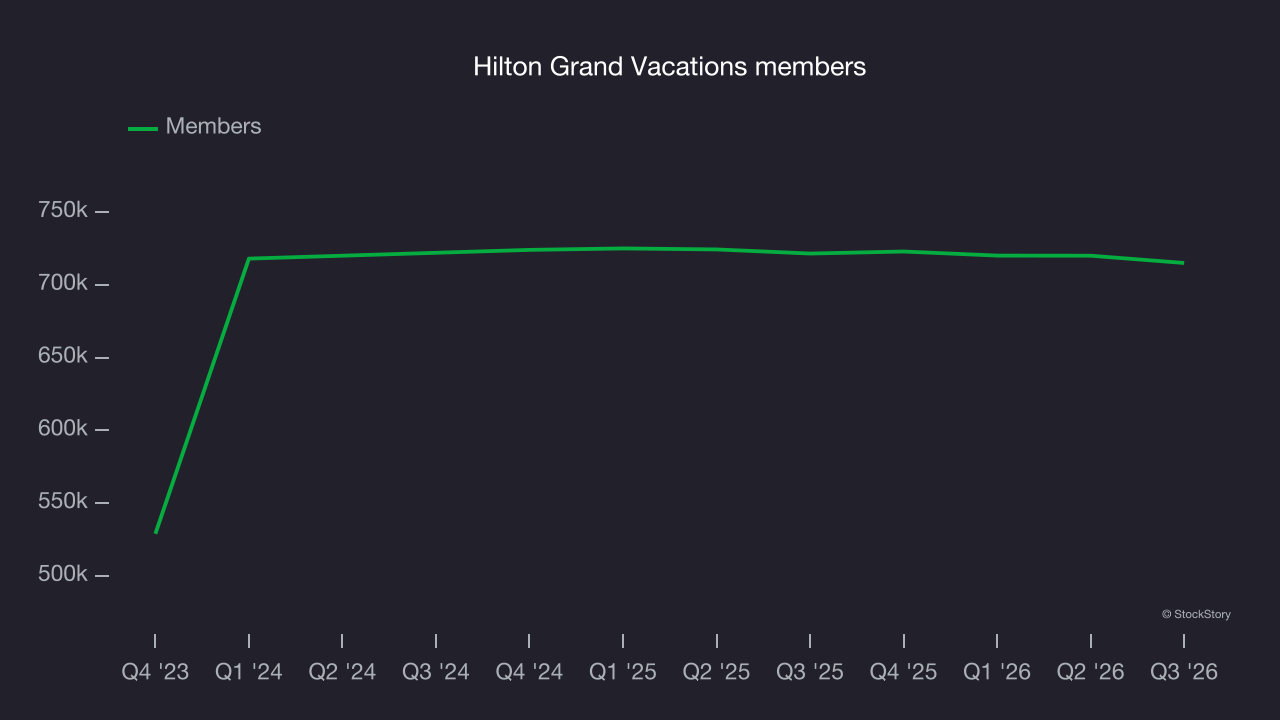
- Members in line with the same quarter last year
- Market capitalization $2.76 billion
“The underlying business model, recurring revenue streams, and cash flow generation of our business remained resilient in the third quarter, but our sales results fell short of our expectations as the initiatives we put in place over the summer to improve execution are taking longer to ramp than we anticipated,” said Mark Wang, CEO of Hilton Grand Vacations. “While we are not satisfied with our third quarter results, we were encouraged to see initial signs of progress as we exited the quarter, and we’ve accelerated our implementation efforts while adding new measures to drive conversion.”
Revenue growth
A company’s long-term performance is an indicator of its overall quality. Any business can deliver a good quarter or two, but the best consistently grow over the long haul. Over the last five years, Hilton Grand Vacations grew its revenue at a 30.6% compounded annual growth rate. Though this growth is acceptable on an absolute basis, revenue growth alone is not enough in the consumer discretionary sector, which can display significant earnings volatility. The bar for the sector is particularly high, reflecting the non-essential and hit-driven nature of the products and services offered. Additionally, the five-year CAGR starts around Covid, when revenue was depressed before rebounding.
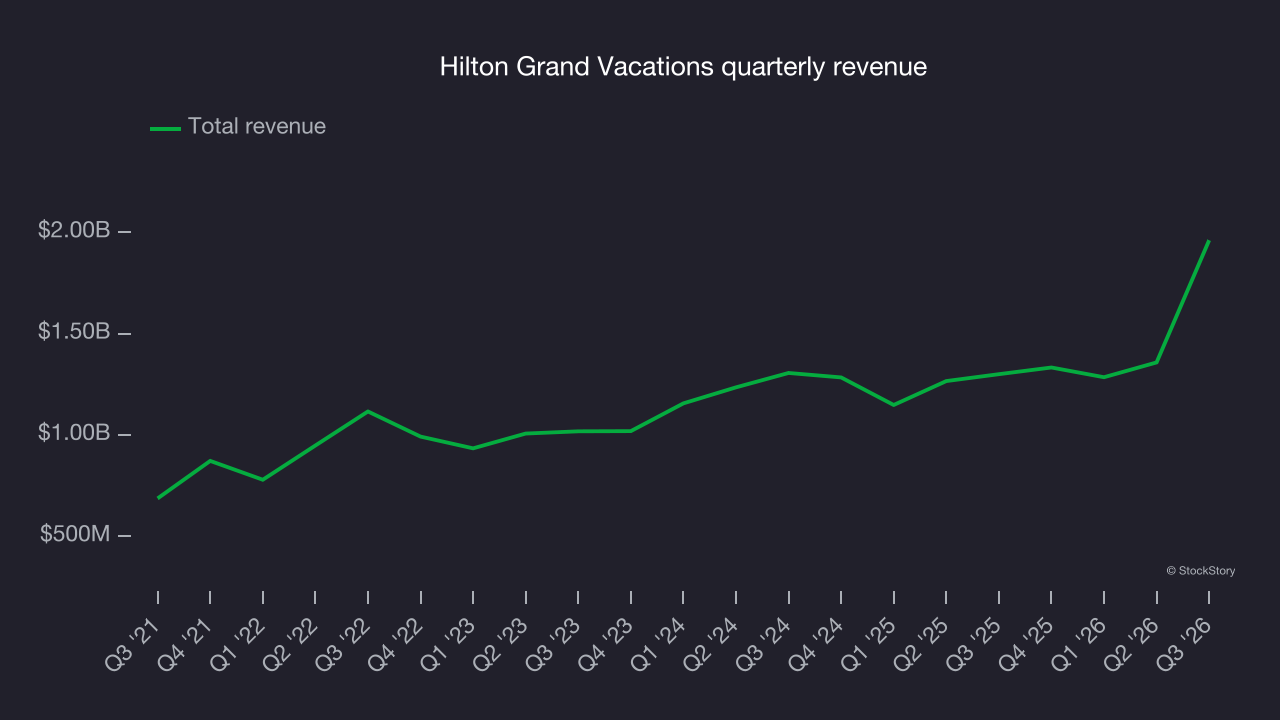
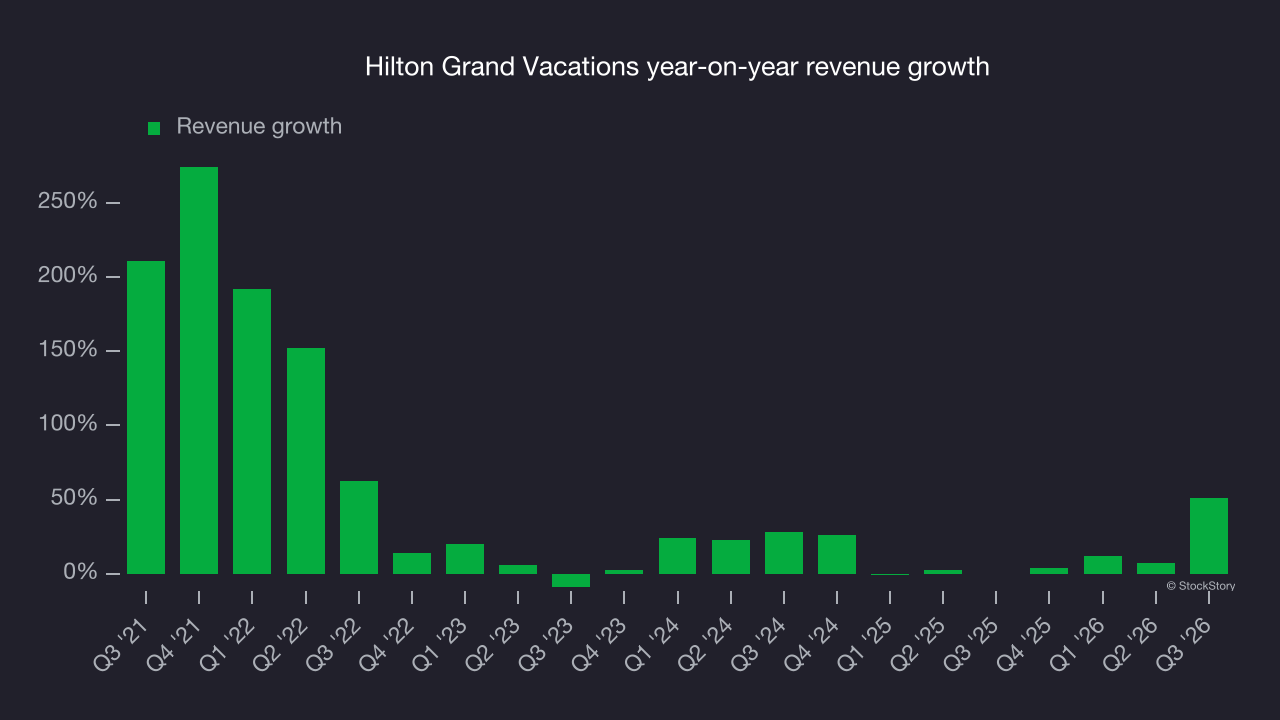
This quarter, Hilton Grand Vacations reported year-on-year revenue growth of 50.8%, and its $1.96 billion of revenue beat Wall Street’s consensus estimates by 39.5%.
Looking ahead, sell-side analysts expect revenue to decline by 3.9% over the next 12 months, according to S&P, a deceleration versus the last two years. This underwhelming projection suggests its products and services will face some demand headwinds.
Earnings per share
Revenue trends explain a company’s historical growth, but the long-term change in earnings per share (EPS) points to the profitability of that growth. For example, a company could inflate its revenue through excessive spending on advertising and promotions.
Hilton Grand Vacations’s EPS grew at a 38.6% compounded annual growth rate over the last five years, higher than its 30.6% annualized revenue growth. However, this alone doesn’t tell us much about its business quality because its operating margin didn’t improve.
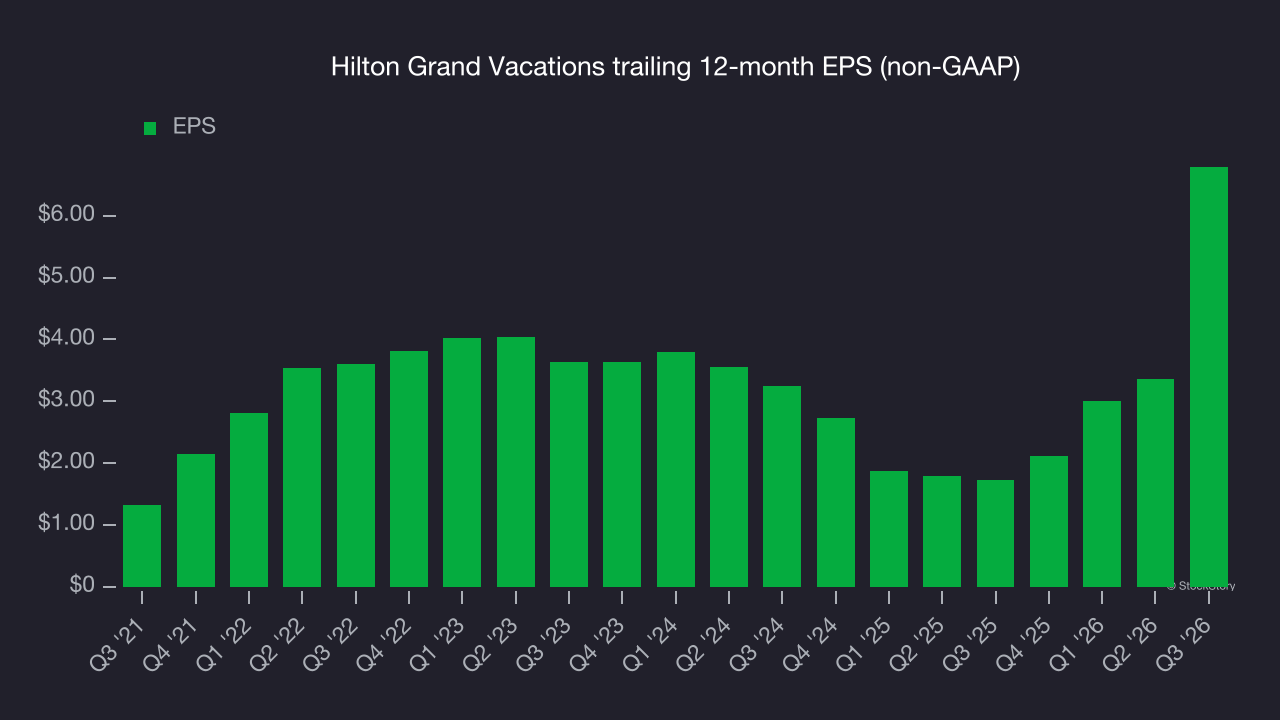
In Q3, Hilton Grand Vacations reported adjusted EPS of $4.03, up from $0.60 in the same quarter last year. This result easily cleared analysts’ consensus estimates. Over the next 12 months, Wall Street expects Hilton Grand Vacations’s full-year EPS to shrink by 25.9% from $6.79 to $5.03, according to S&P.
Key takeaways from Hilton Grand Vacations’s Q3 results
Hilton Grand Vacations delivered a solid quarter, with EBITDA beating Wall Street’s consensus estimates by a wide margin and EPS also topping analysts’ consensus estimates. Shares rose 3.9% to $36.93 immediately after the report.
Hilton Grand Vacations reported solid quarterly earnings, but that alone doesn’t determine whether the stock is a good investment. An investment decision should consider the bigger picture of valuation and business quality as well as the latest earnings. For more on those factors, read the full research report here (it’s free).