Industrial products company CSW (NYSE: CSW) reported calendar Q3 2026 (fiscal Q2 2027) results topping the market’s revenue expectations, with revenue up 30.5% year on year to $361.4 million. Its non-GAAP profit of $3.66 per share was 0.8% above analysts’ consensus estimates.
For more on CSW, read our free full research report.
CSW (CSW) Q3 CY2026 highlights:
- Revenue $361.4 million vs S&P analysts’ consensus estimates of $350.8 million (30.5% year-on-year growth, 3% beat)
- Adjusted EPS $3.66 vs S&P analysts’ consensus estimates of $3.63 (0.8% beat)
- Adjusted EBITDA $96.71 million vs analysts’ consensus estimates of $97.11 million (26.8% margin, in line)
- Operating margin 20.9%, in line with the same quarter last year
- Free cash flow margin 25.4%, up from 21.2% in the same quarter last year
- Market capitalization $4.77 billion
Armes continued, "Our optimistic outlook for the remainder of fiscal 2027 is unchanged. We expect to deliver sustained organic revenue growth in excess of the markets we serve. We may have some short-term margin headwinds due to recent cost increases, but we remain confident in our long-term ability to achieve adjusted EBITDA growth in excess of our revenue growth as well as strong cash flow conversion. We remain focused on maximizing long-term shareholder value through prudent financial management, disciplined capital allocation, and rigorous cost management, which together we expect will accelerate our growth in profitability."
Revenue growth
A company’s long-term revenue performance can indicate its overall quality. Even a weak business can perform well for one or two quarters, but a top-tier one grows for years. CSW’s 18.3% annualized revenue growth over the last five years was strong. Its growth surpassed the average industrials company and shows its offerings resonate with customers.
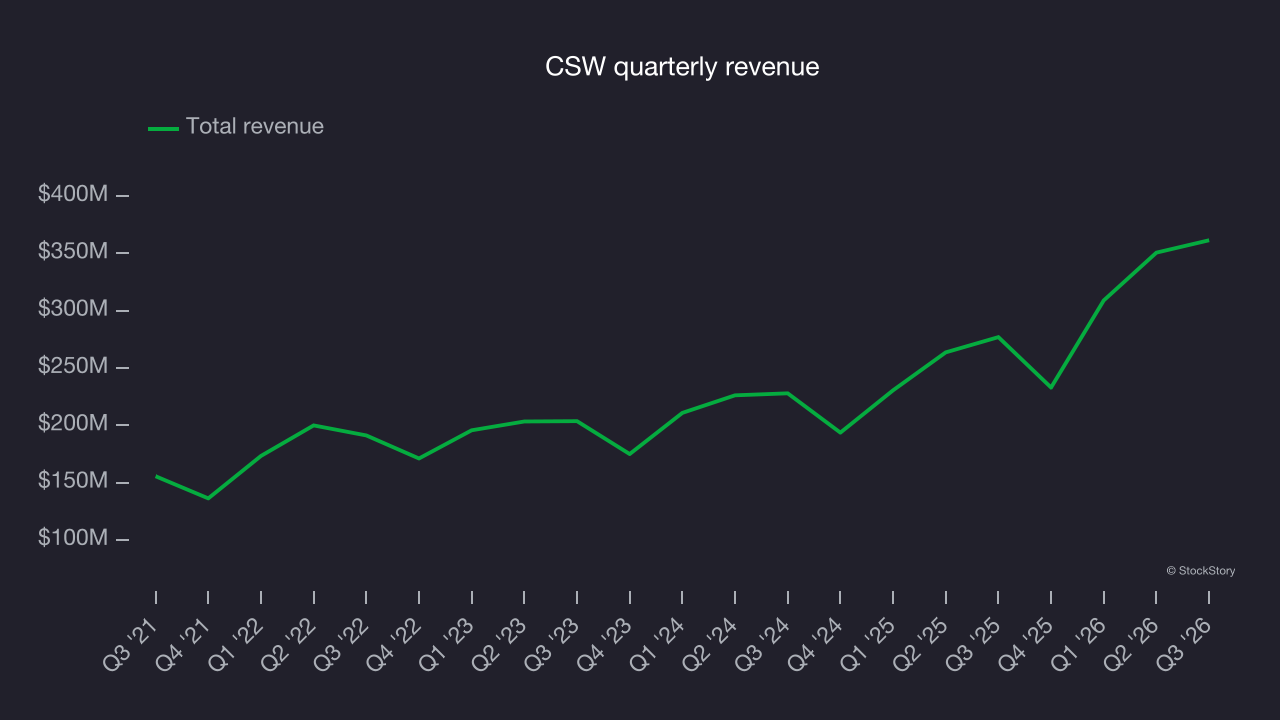
Long-term growth matters most, but within industrials, a half-decade historical view may miss cycles, industry trends or a company capitalizing on catalysts such as a new contract win or a successful product line. CSW’s annualized revenue growth of 22.2% over the last two years is above its five-year trend, suggesting its demand was strong and recently accelerated. 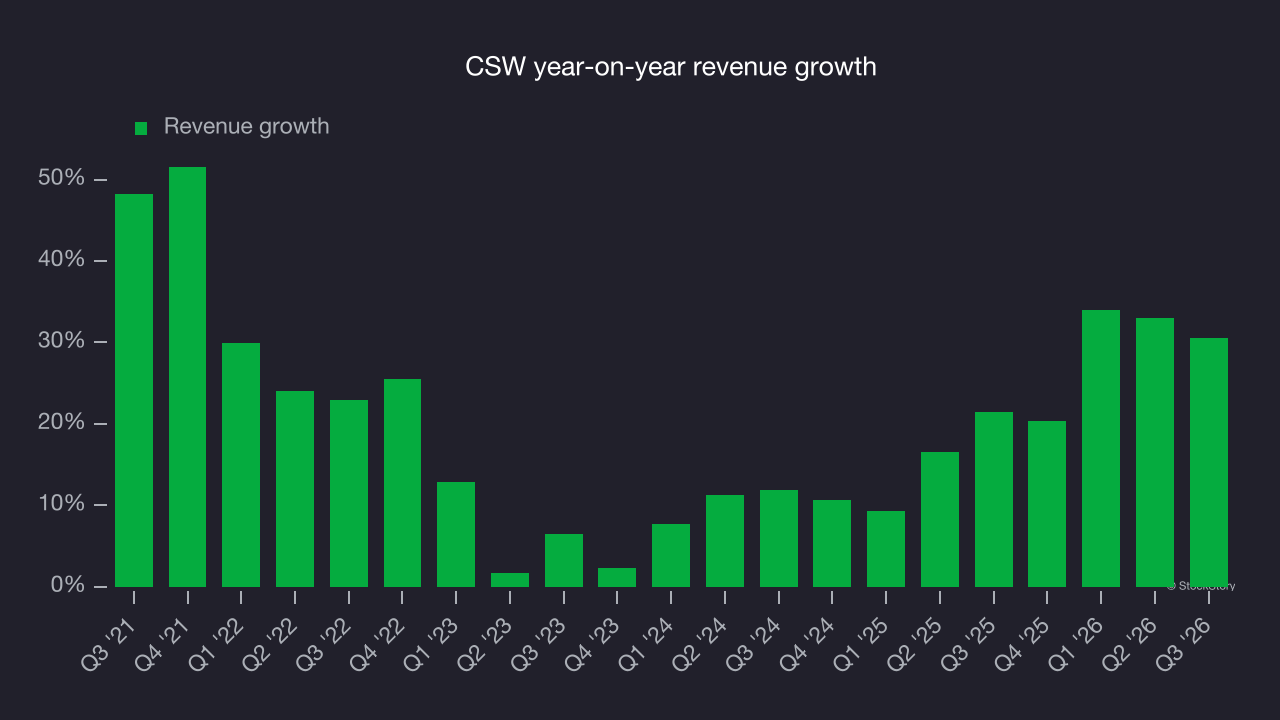
This quarter, CSW reported year-on-year revenue growth of 30.5%, and its $361.4 million of revenue exceeded Wall Street’s consensus estimates by 3%.
Looking ahead, sell-side analysts expect revenue to grow 4.6% over the next 12 months, according to S&P, a deceleration versus the last two years. This underwhelming projection implies its products and services will face some demand challenges. Still, the company is tracking well in other measures of financial health.
Operating margin
Operating margin is a key measure of profitability. Think of it as net income – the bottom line – excluding the impact of taxes and interest on debt, which are less connected to business fundamentals.
CSW’s operating margin has generally stayed the same over the last 12 months, averaging 18.7% over the last five years. This profitability was high for an industrials business thanks to its efficient cost structure and economies of scale. This is reflected in its fast historical revenue growth and healthy gross margin, which is why all three data points should be considered together.
Looking at the trend in its profitability, CSW’s operating margin might have fluctuated slightly but has generally stayed the same over the last five years. This raises questions about the company’s expense base because its revenue growth should have given it leverage on its fixed costs, resulting in better economies of scale and profitability.
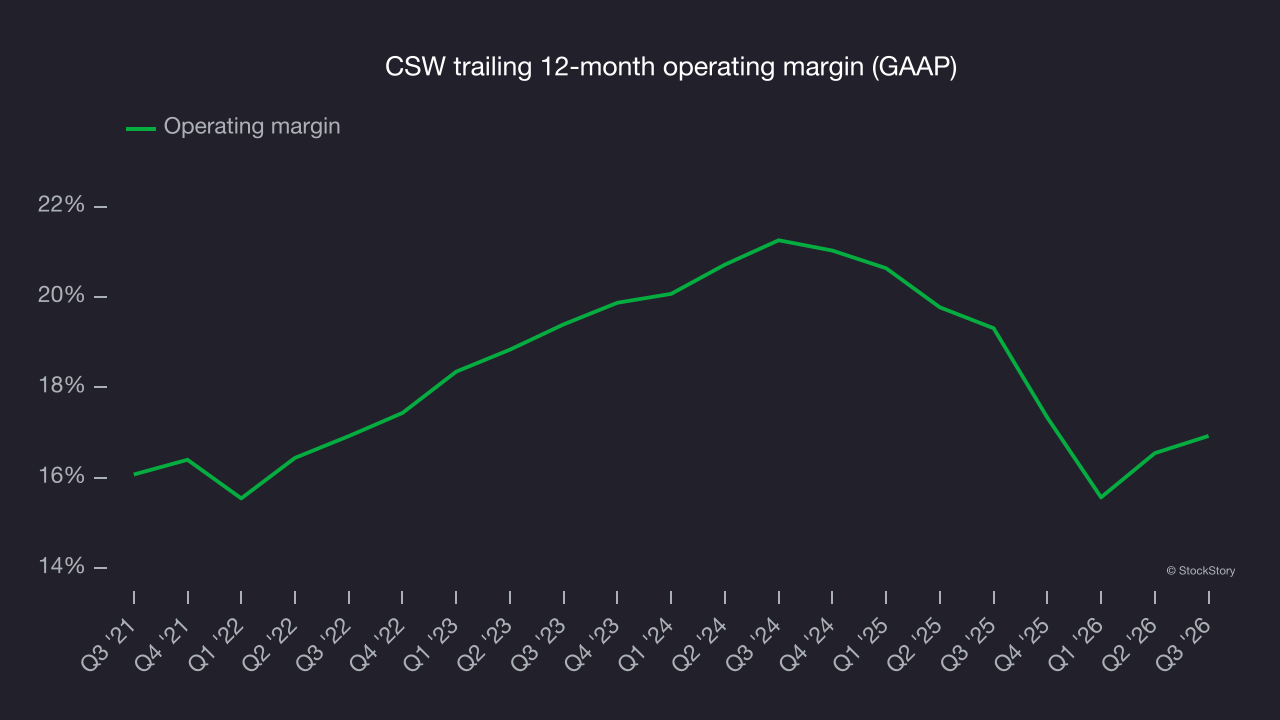
This quarter, CSW reported an operating margin of 20.9%, in line with the same quarter last year. This indicates the company’s cost structure has recently been stable.
Earnings per share
We track the long-term change in earnings per share (EPS) for the same reason as long-term revenue growth. Compared to revenue, however, EPS highlights whether a company’s growth is profitable.
CSW’s EPS grew at a 30.6% compounded annual growth rate over the last five years, higher than its 18.3% annualized revenue growth. This indicates the company became more profitable on a per-share basis as it expanded.
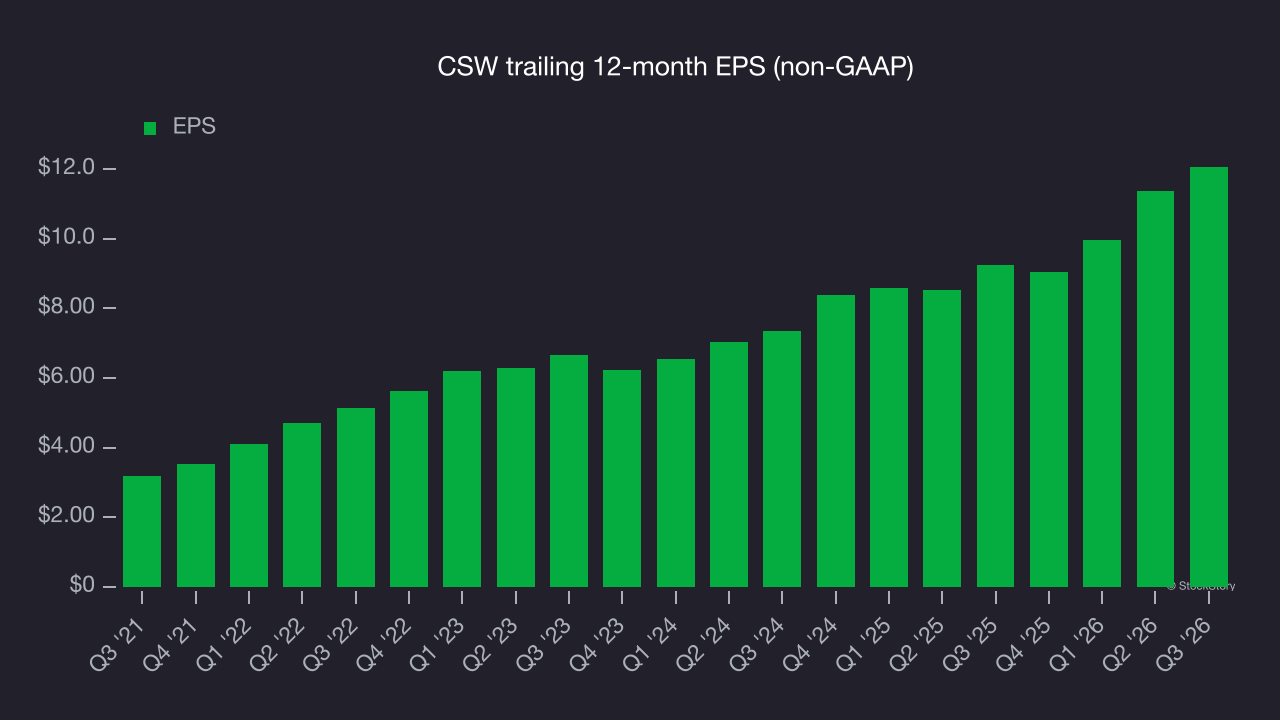
Like with revenue, we analyze EPS over a more recent period because it can provide insight into an emerging theme or development for the business.
For CSW, its two-year annual EPS growth of 28% was lower than its five-year trend. Still, growth was good, and an acceleration would be welcome.
In Q3, CSW reported adjusted EPS of $3.66, up from $2.96 in the same quarter last year. This result was close to analysts’ consensus estimates. Over the next 12 months, Wall Street expects CSW’s full-year EPS to grow 9.1% from $12.06 to $13.16, according to S&P.
Key takeaways from CSW’s Q3 results
CSW delivered a quarter with some key positives, including revenue that topped analysts’ consensus estimates. Shares remained flat at $292.42 immediately after the release.
CSW had a solid quarter, but one earnings result doesn’t necessarily make the stock a buy. The latest quarter matters, but longer-term business quality and valuation matter more when deciding whether to invest. Read our full research report here (it’s free).