Over the past six months, Stitch Fix’s shares (currently trading at $3.33) have posted a disappointing 11.9% loss while the S&P 500 was down 6.2%. This may have investors wondering how to approach the situation.
Is now the time to buy Stitch Fix, or should you be careful about including it in your portfolio? Get the full stock story straight from our expert analysts, it’s free.
Why Do We Think Stitch Fix Will Underperform?
Even with the cheaper entry price, we're swiping left on Stitch Fix for now. Here are three reasons why you should be careful with SFIX and a stock we'd rather own.
1. Decline in Active Clients Points to Weak Demand
Revenue growth can be broken down into changes in price and volume (for companies like Stitch Fix, our preferred volume metric is active clients). While both are important, the latter is the most critical to analyze because prices have a ceiling.
Stitch Fix’s active clients came in at 2.37 million in the latest quarter, and over the last two years, averaged 17.4% year-on-year declines. This performance was underwhelming and implies there may be increasing competition or market saturation. It also suggests Stitch Fix might have to lower prices or invest in product improvements to grow, factors that can hinder near-term profitability. 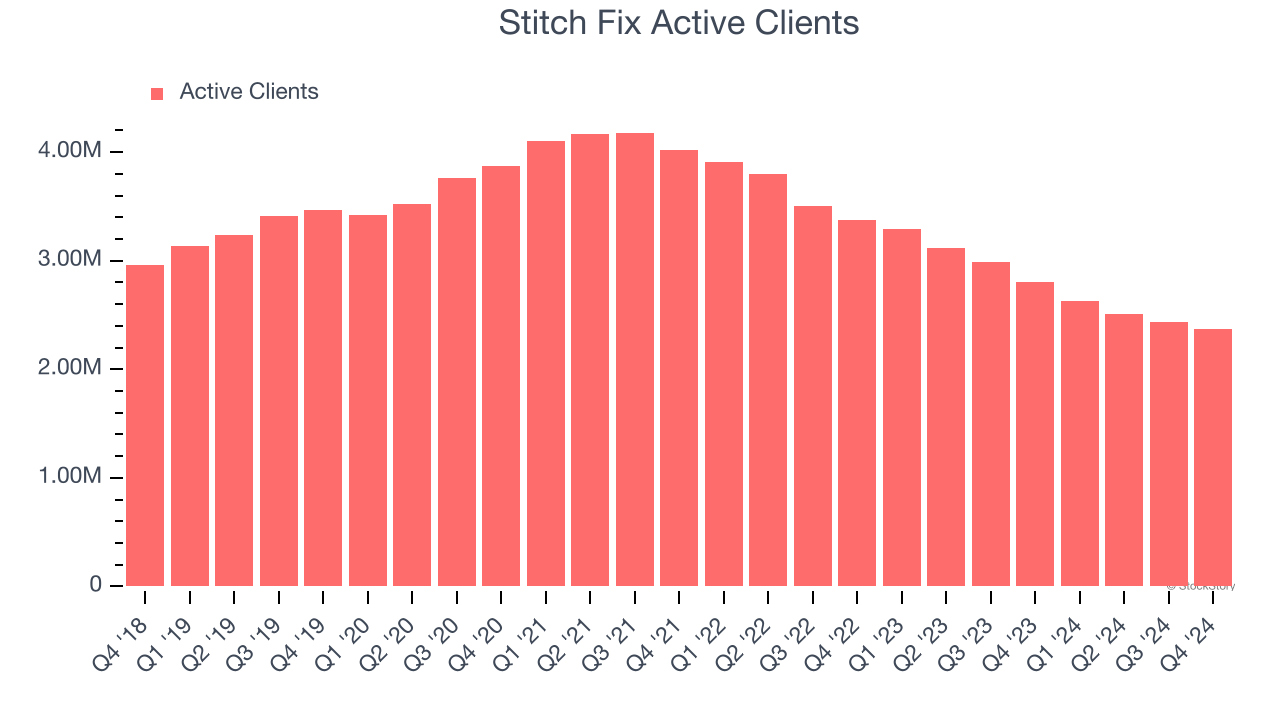
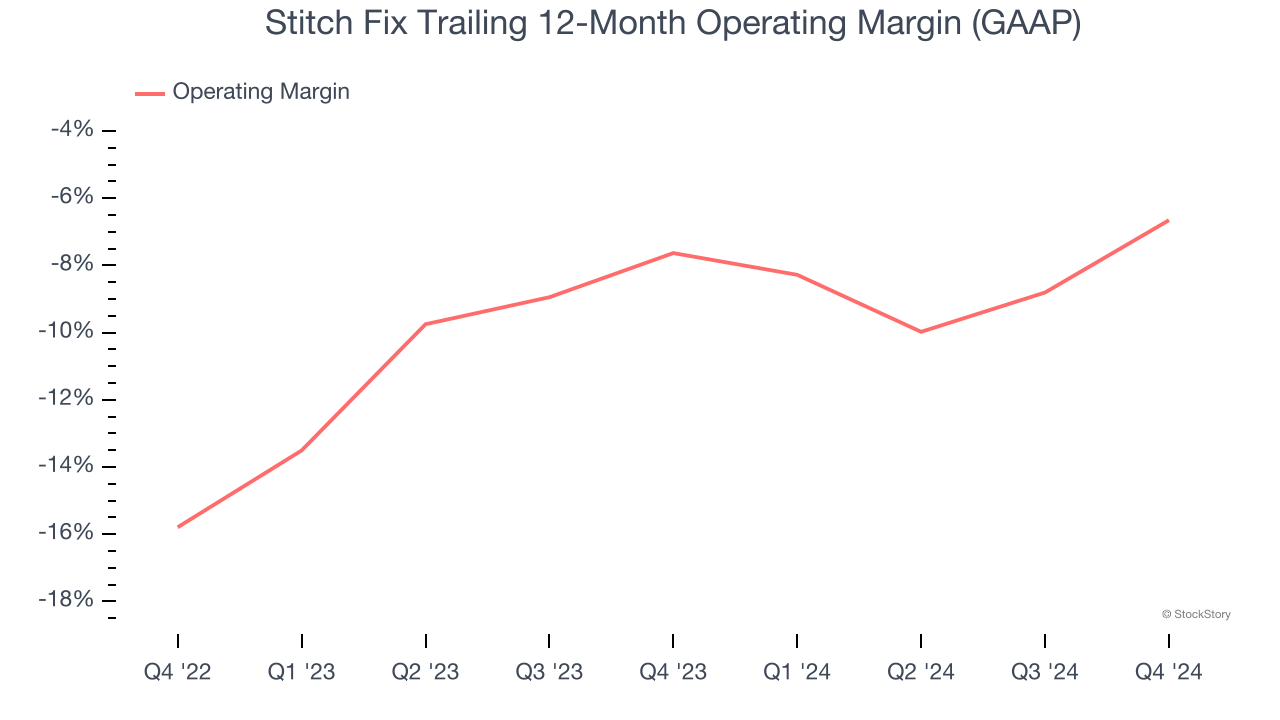
2. Operating Losses Sound the Alarms
Operating margin is a key measure of profitability. Think of it as net income - the bottom line - excluding the impact of taxes and interest on debt, which are less connected to business fundamentals.
Stitch Fix’s operating margin might fluctuated slightly over the last 12 months but has generally stayed the same, averaging negative 7.2% over the last two years. Unprofitable consumer discretionary companies that fail to improve their losses or grow sales rapidly deserve extra scrutiny. For the time being, it’s unclear if Stitch Fix’s business model is sustainable.
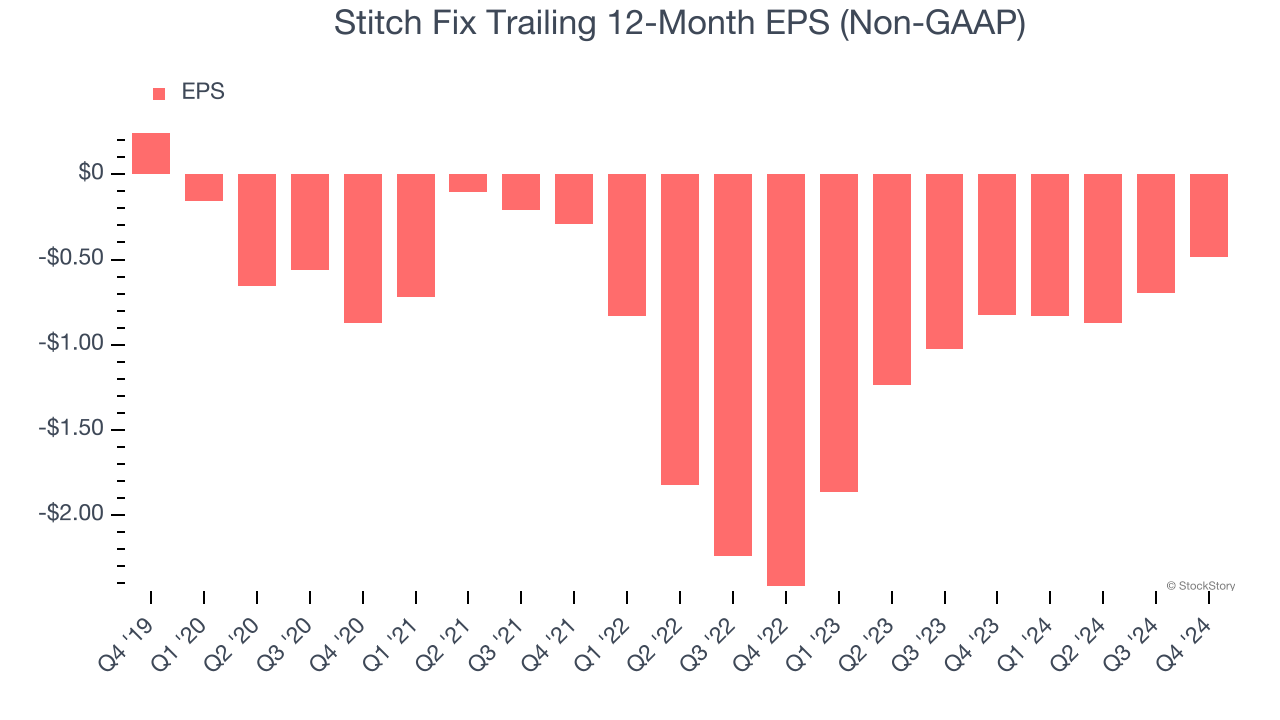
3. EPS Trending Down
We track the long-term change in earnings per share (EPS) because it highlights whether a company’s growth is profitable.
Sadly for Stitch Fix, its EPS declined by 31.9% annually over the last five years, more than its revenue. This tells us the company struggled because its fixed cost base made it difficult to adjust to shrinking demand.
Final Judgment
We cheer for all companies serving everyday consumers, but in the case of Stitch Fix, we’ll be cheering from the sidelines. Following the recent decline, the stock trades at 11.8× forward EV-to-EBITDA (or $3.33 per share). This multiple tells us a lot of good news is priced in - we think there are better investment opportunities out there. We’d suggest looking at our favorite semiconductor picks and shovels play.
Stocks We Would Buy Instead of Stitch Fix
The market surged in 2024 and reached record highs after Donald Trump’s presidential victory in November, but questions about new economic policies are adding much uncertainty for 2025.
While the crowd speculates what might happen next, we’re homing in on the companies that can succeed regardless of the political or macroeconomic environment. Put yourself in the driver’s seat and build a durable portfolio by checking out our Top 9 Market-Beating Stocks. This is a curated list of our High Quality stocks that have generated a market-beating return of 175% over the last five years.
Stocks that made our list in 2019 include now familiar names such as Nvidia (+2,183% between December 2019 and December 2024) as well as under-the-radar businesses like Sterling Infrastructure (+1,096% five-year return). Find your next big winner with StockStory today.