Travel technology company Sabre (NASDAQ: SABR) missed Wall Street’s revenue expectations in Q1 CY2025, with sales flat year on year at $776.6 million. Next quarter’s revenue guidance of $786.4 million underwhelmed, coming in 1.8% below analysts’ estimates. Its non-GAAP loss of $0 per share was in line with analysts’ consensus estimates.
Is now the time to buy Sabre? Find out by accessing our full research report, it’s free.
Sabre (SABR) Q1 CY2025 Highlights:
- Revenue: $776.6 million vs analyst estimates of $794.6 million (flat year on year, 2.3% miss)
- Adjusted EPS: $0 vs analyst estimates of $0.01 (in line)
- Adjusted EBITDA: $149.6 million vs analyst estimates of $154.2 million (19.3% margin, 3% miss)
- Revenue Guidance for Q2 CY2025 is $786.4 million at the midpoint, below analyst estimates of $801 million
- EBITDA guidance for the full year is $63 million at the midpoint, below analyst estimates of $673 million
- Operating Margin: 13.3%, in line with the same quarter last year
- Free Cash Flow was -$98.49 million compared to -$95.77 million in the same quarter last year
- Total Bookings: 96.36 million, down 2.1 million year on year
- Market Capitalization: $945.9 million
Company Overview
Originally a division of American Airlines, Sabre (NASDAQ: SABR) is a technology provider for the global travel and tourism industry.
Sales Growth
Reviewing a company’s long-term sales performance reveals insights into its quality. Any business can put up a good quarter or two, but many enduring ones grow for years. Sabre’s demand was weak over the last five years as its sales fell at a 3.3% annual rate. This was below our standards and is a sign of lacking business quality.
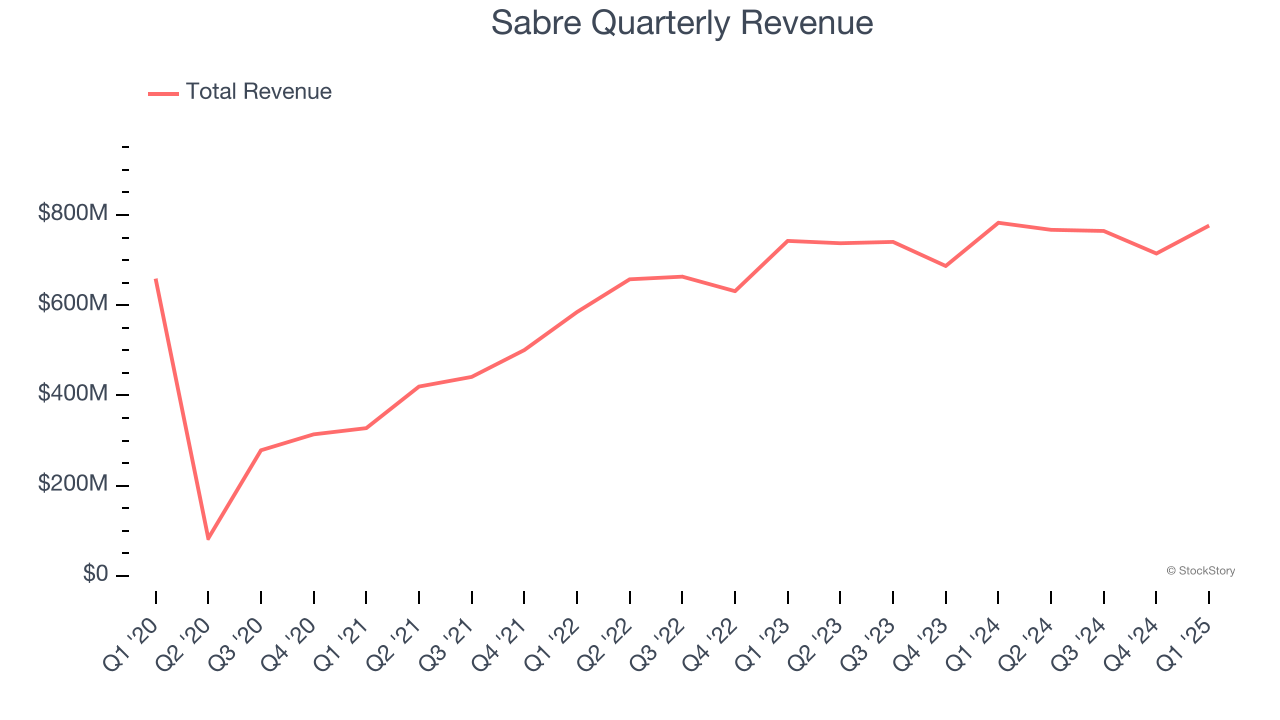
We at StockStory place the most emphasis on long-term growth, but within consumer discretionary, a stretched historical view may miss a company riding a successful new property or trend. Sabre’s annualized revenue growth of 5.9% over the last two years is above its five-year trend, but we were still disappointed by the results. 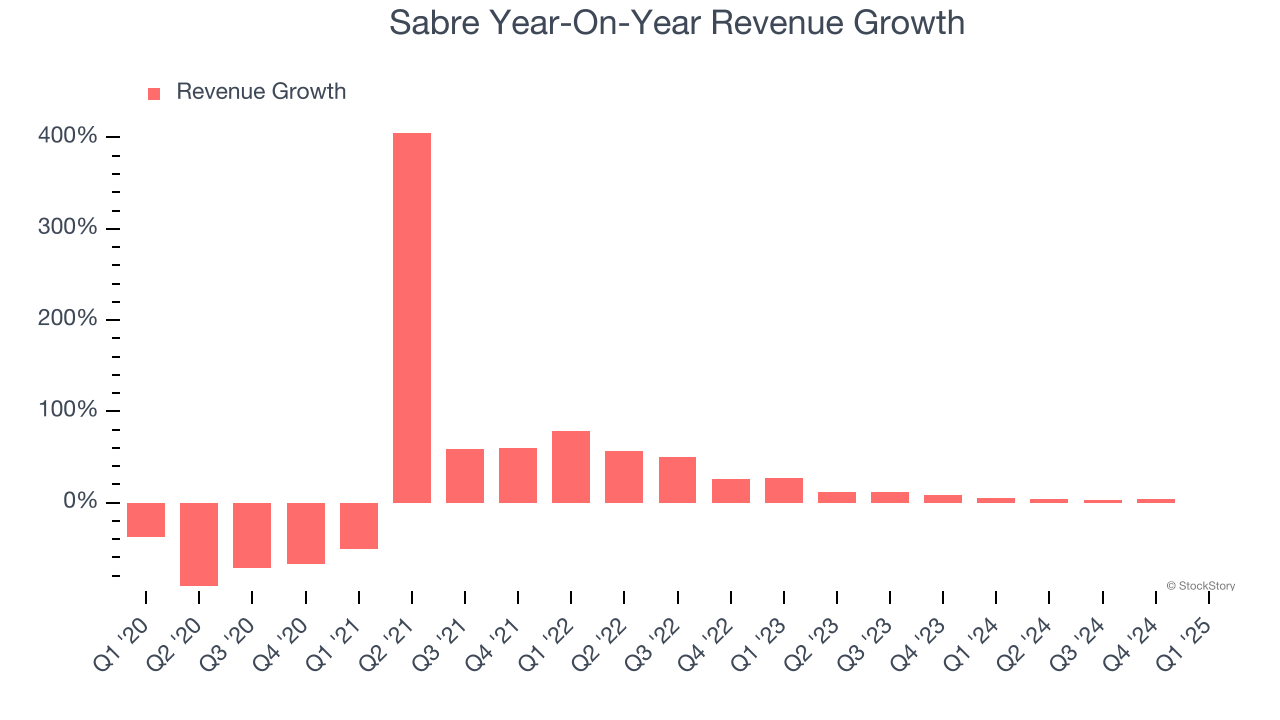
We can better understand the company’s revenue dynamics by analyzing its number of total bookings and central reservation system transactions, which clocked in at 96.36 million and 30.77 million in the latest quarter. Over the last two years, Sabre’s total bookings averaged 4.3% year-on-year growth while its central reservation system transactions averaged 5.6% year-on-year growth. 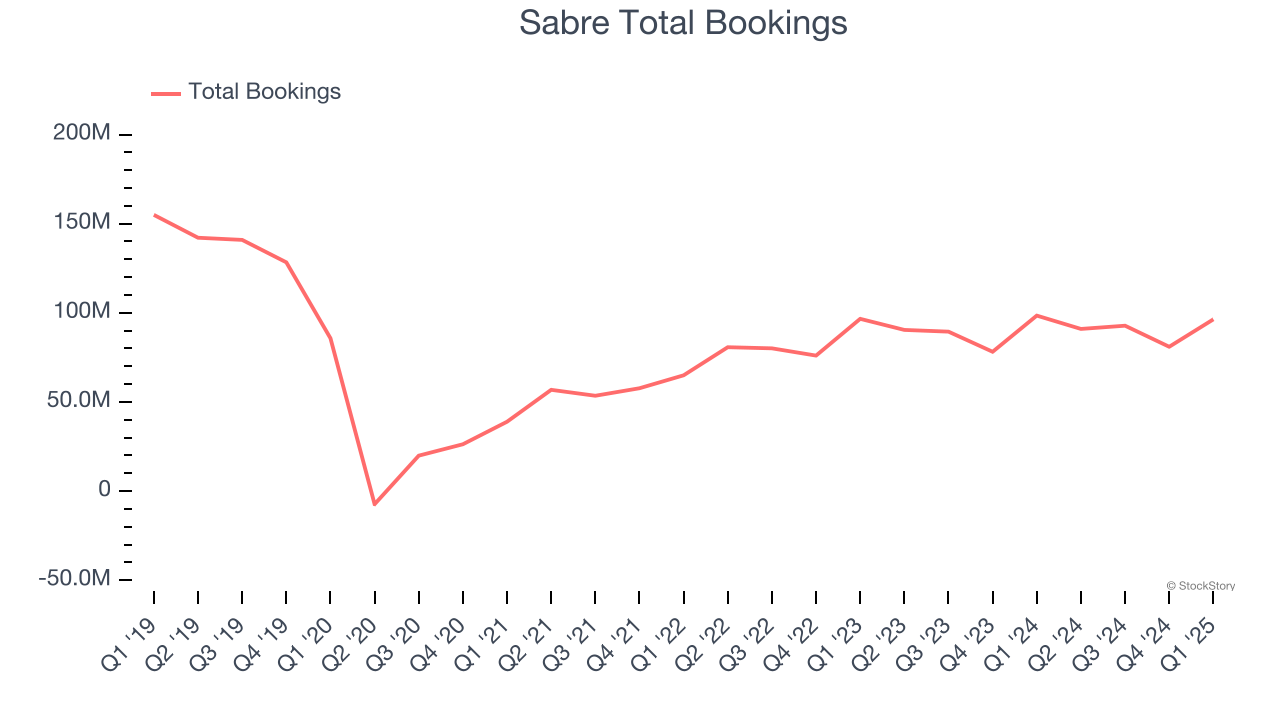
This quarter, Sabre missed Wall Street’s estimates and reported a rather uninspiring 0.8% year-on-year revenue decline, generating $776.6 million of revenue. Company management is currently guiding for a 2.5% year-on-year increase in sales next quarter.
Looking further ahead, sell-side analysts expect revenue to grow 7.5% over the next 12 months. Although this projection implies its newer products and services will catalyze better top-line performance, it is still below the sector average.
Today’s young investors won’t have read the timeless lessons in Gorilla Game: Picking Winners In High Technology because it was written more than 20 years ago when Microsoft and Apple were first establishing their supremacy. But if we apply the same principles, then enterprise software stocks leveraging their own generative AI capabilities may well be the Gorillas of the future. So, in that spirit, we are excited to present our Special Free Report on a profitable, fast-growing enterprise software stock that is already riding the automation wave and looking to catch the generative AI next.
Operating Margin
Sabre’s operating margin has risen over the last 12 months and averaged 7.3% over the last two years. The company’s higher efficiency is a breath of fresh air, but its suboptimal cost structure means it still sports paltry profitability for a consumer discretionary business.
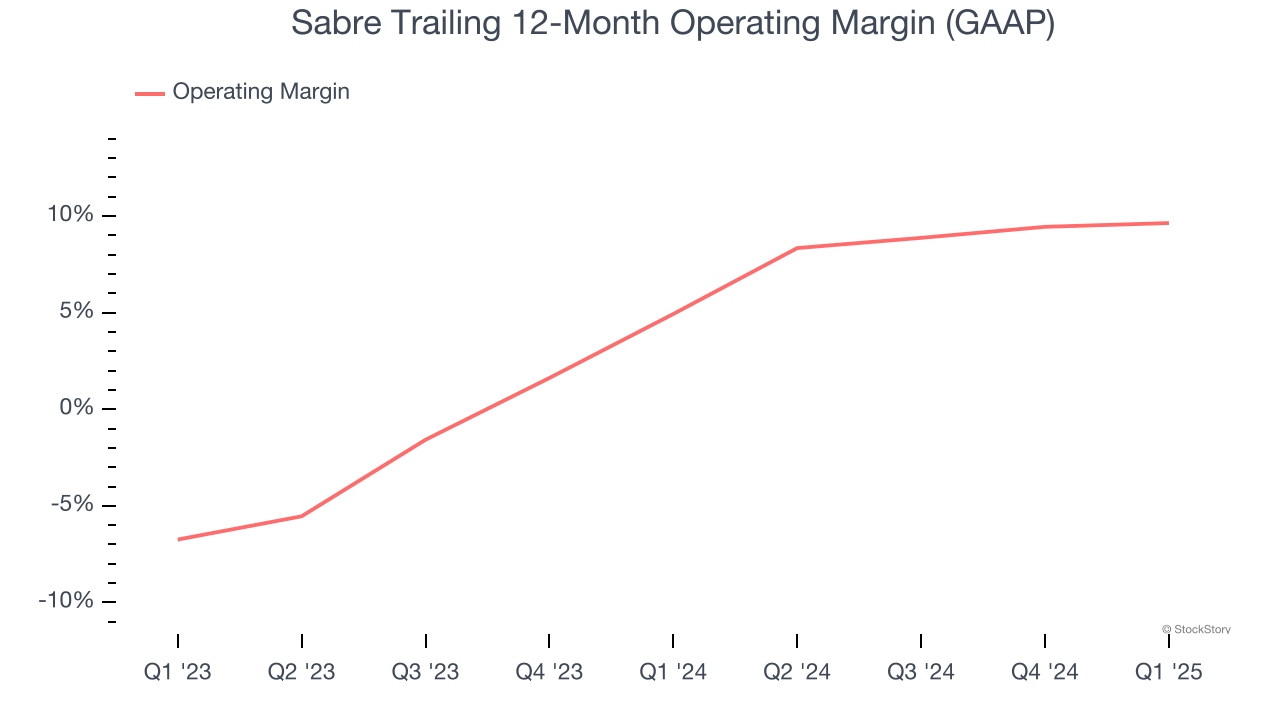
This quarter, Sabre generated an operating profit margin of 13.3%, in line with the same quarter last year. This indicates the company’s overall cost structure has been relatively stable.
Earnings Per Share
Revenue trends explain a company’s historical growth, but the long-term change in earnings per share (EPS) points to the profitability of that growth – for example, a company could inflate its sales through excessive spending on advertising and promotions.
Sadly for Sabre, its EPS declined by 19.6% annually over the last five years, more than its revenue. However, its operating margin actually expanded during this time, telling us that non-fundamental factors such as interest expenses and taxes affected its ultimate earnings.
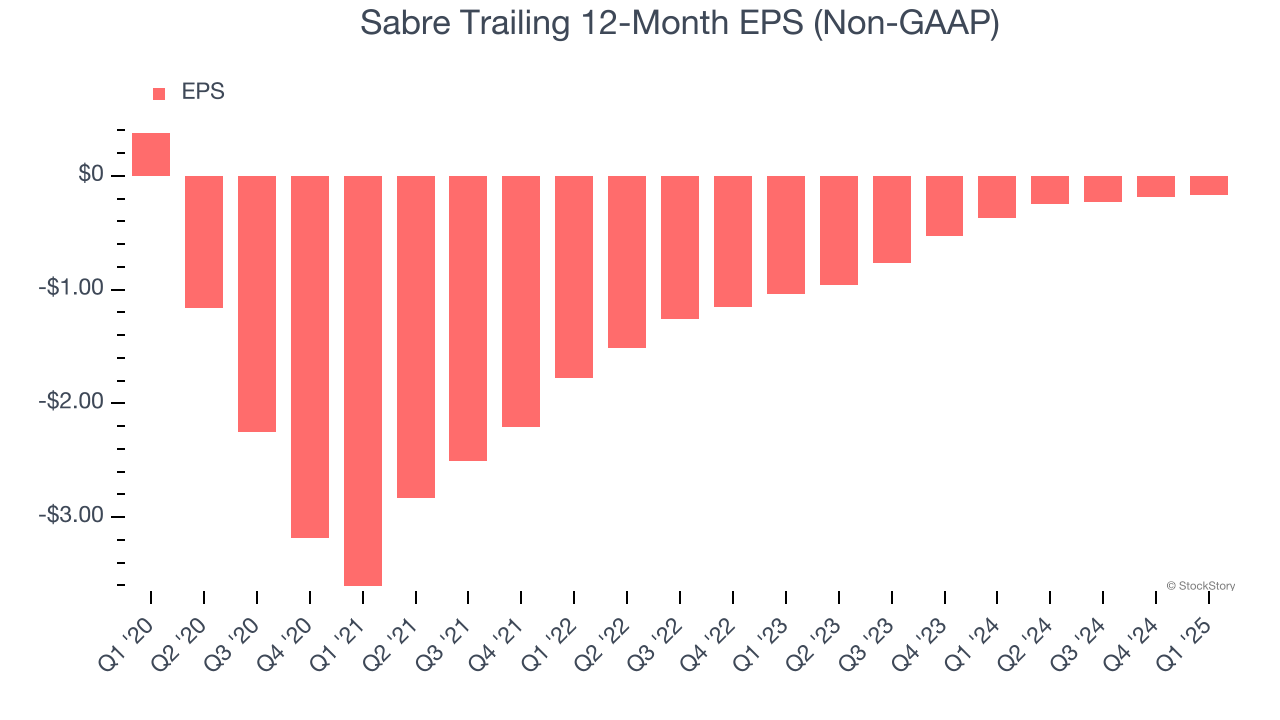
In Q1, Sabre reported EPS at $0, up from negative $0.02 in the same quarter last year. Despite growing year on year, this print missed analysts’ estimates. Over the next 12 months, Wall Street is optimistic. Analysts forecast Sabre’s full-year EPS of negative $0.17 will reach break even.
Key Takeaways from Sabre’s Q1 Results
We struggled to find many positives in these results. Its full-year EBITDA guidance missed significantly and its EPS fell short of Wall Street’s estimates. Overall, this was a softer quarter. The stock traded down 2% to $2.41 immediately after reporting.
Sabre didn’t show it’s best hand this quarter, but does that create an opportunity to buy the stock right now? We think that the latest quarter is only one piece of the longer-term business quality puzzle. Quality, when combined with valuation, can help determine if the stock is a buy. We cover that in our actionable full research report which you can read here, it’s free.