


Workplace furnishings manufacturer HNI Corporation (NYSE: HNI) beat Wall Street’s revenue expectations in Q1 CY2025, with sales up 2% year on year to $599.8 million. Its non-GAAP profit of $0.44 per share was 29.4% above analysts’ consensus estimates.
Is now the time to buy HNI? Find out by accessing our full research report, it’s free.
HNI (HNI) Q1 CY2025 Highlights:
- Revenue: $599.8 million vs analyst estimates of $580.5 million (2% year-on-year growth, 3.3% beat)
- Adjusted EPS: $0.44 vs analyst estimates of $0.34 (29.4% beat)
- Adjusted EBITDA: $56.7 million vs analyst estimates of $54.09 million (9.5% margin, 4.8% beat)
- Operating Margin: 4.1%, down from 5.1% in the same quarter last year
- Free Cash Flow was -$3.7 million compared to -$15 million in the same quarter last year
- Market Capitalization: $2.04 billion
“Our first quarter results demonstrate our ability to manage through varying macroeconomic conditions, while remaining focused on the future. And while we expect macro headwinds and demand volatility over the near-term, based on our leading indicators—both external and internal, we expect strong results to continue, driven by our margin expansion efforts and a return of volume growth,” stated Jeff Lorenger, Chairman, President, and Chief Executive Officer.
Company Overview
With roots dating back to 1944 and a significant acquisition of Kimball International in 2023, HNI (NYSE: HNI) manufactures and sells office furniture systems, seating, and storage solutions, as well as residential fireplaces and heating products.
Sales Growth
A company’s long-term performance is an indicator of its overall quality. Any business can put up a good quarter or two, but the best consistently grow over the long haul.
With $2.54 billion in revenue over the past 12 months, HNI is a mid-sized business services company, which sometimes brings disadvantages compared to larger competitors benefiting from better economies of scale.
As you can see below, HNI’s 2.7% annualized revenue growth over the last five years was sluggish. This shows it failed to generate demand in any major way and is a rough starting point for our analysis.
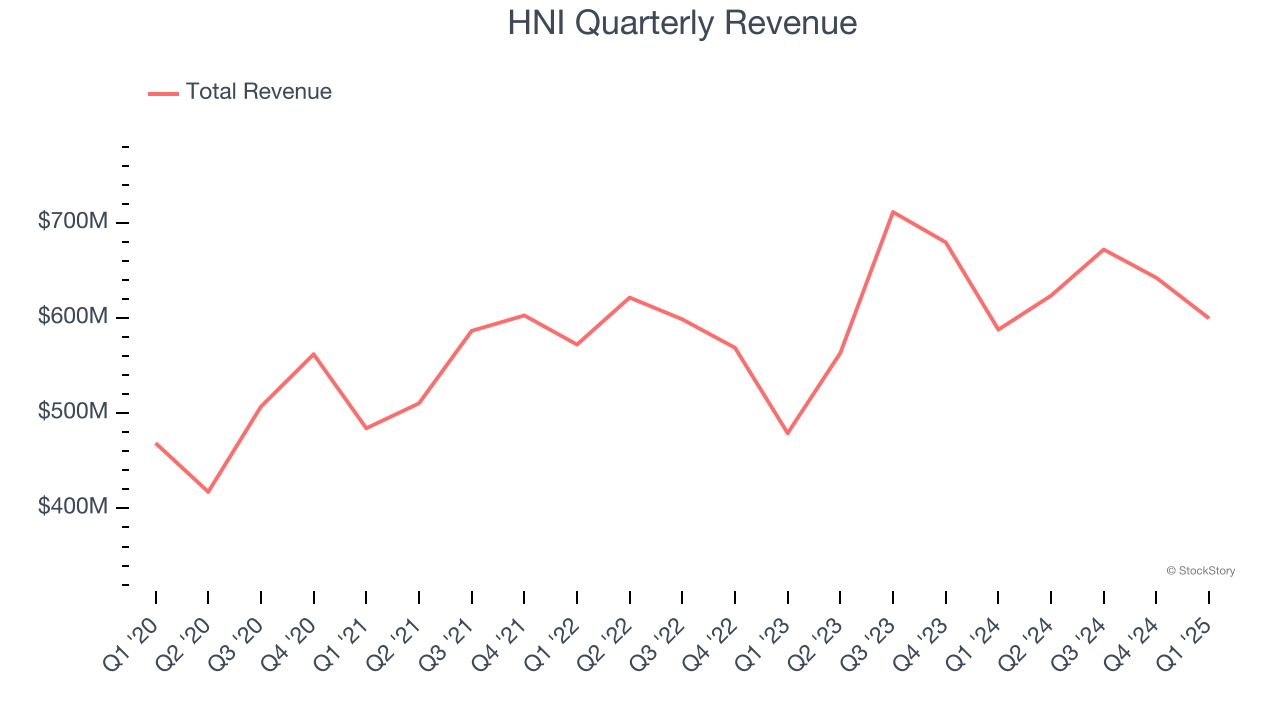
We at StockStory place the most emphasis on long-term growth, but within business services, a half-decade historical view may miss recent innovations or disruptive industry trends. HNI’s annualized revenue growth of 5.8% over the last two years is above its five-year trend, suggesting some bright spots. 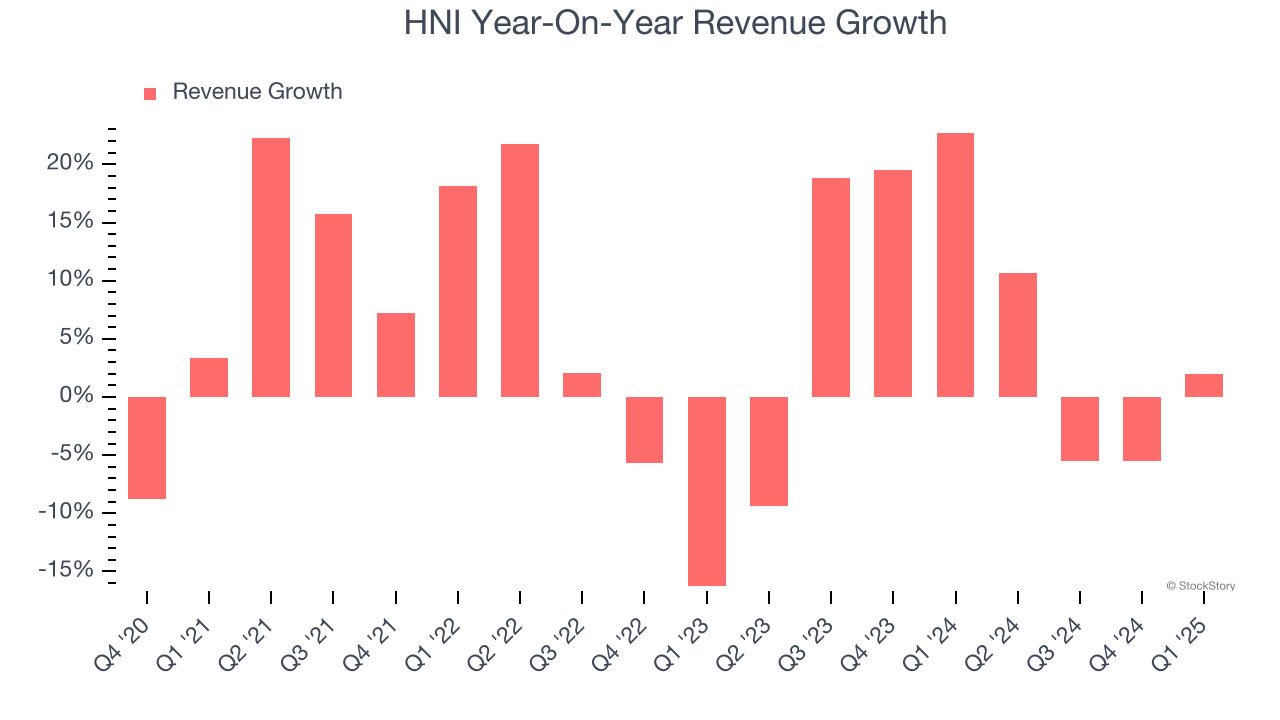
This quarter, HNI reported modest year-on-year revenue growth of 2% but beat Wall Street’s estimates by 3.3%.
Looking ahead, sell-side analysts expect revenue to grow 2.5% over the next 12 months, a deceleration versus the last two years. This projection doesn't excite us and suggests its products and services will see some demand headwinds.
Unless you’ve been living under a rock, it should be obvious by now that generative AI is going to have a huge impact on how large corporations do business. While Nvidia and AMD are trading close to all-time highs, we prefer a lesser-known (but still profitable) stock benefiting from the rise of AI. Click here to access our free report one of our favorites growth stories.
Operating Margin
Operating margin is one of the best measures of profitability because it tells us how much money a company takes home after subtracting all core expenses, like marketing and R&D.
HNI was profitable over the last five years but held back by its large cost base. Its average operating margin of 6.4% was weak for a business services business.
On the plus side, HNI’s operating margin rose by 2.5 percentage points over the last five years, as its sales growth gave it operating leverage.
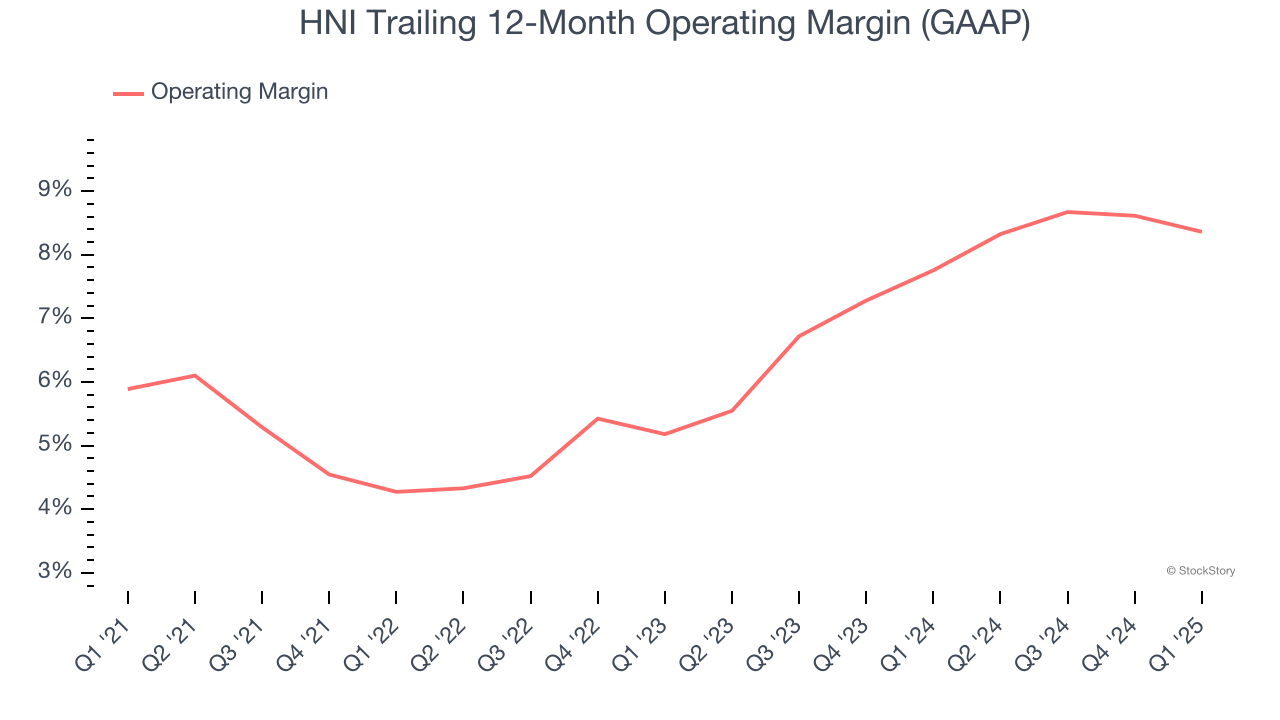
This quarter, HNI generated an operating profit margin of 4.1%, down 1 percentage points year on year. This reduction is quite minuscule and indicates the company’s overall cost structure has been relatively stable.
Earnings Per Share
Revenue trends explain a company’s historical growth, but the long-term change in earnings per share (EPS) points to the profitability of that growth – for example, a company could inflate its sales through excessive spending on advertising and promotions.
HNI’s weak 2.3% annual EPS growth over the last five years aligns with its revenue performance. On the bright side, this tells us its incremental sales were profitable.
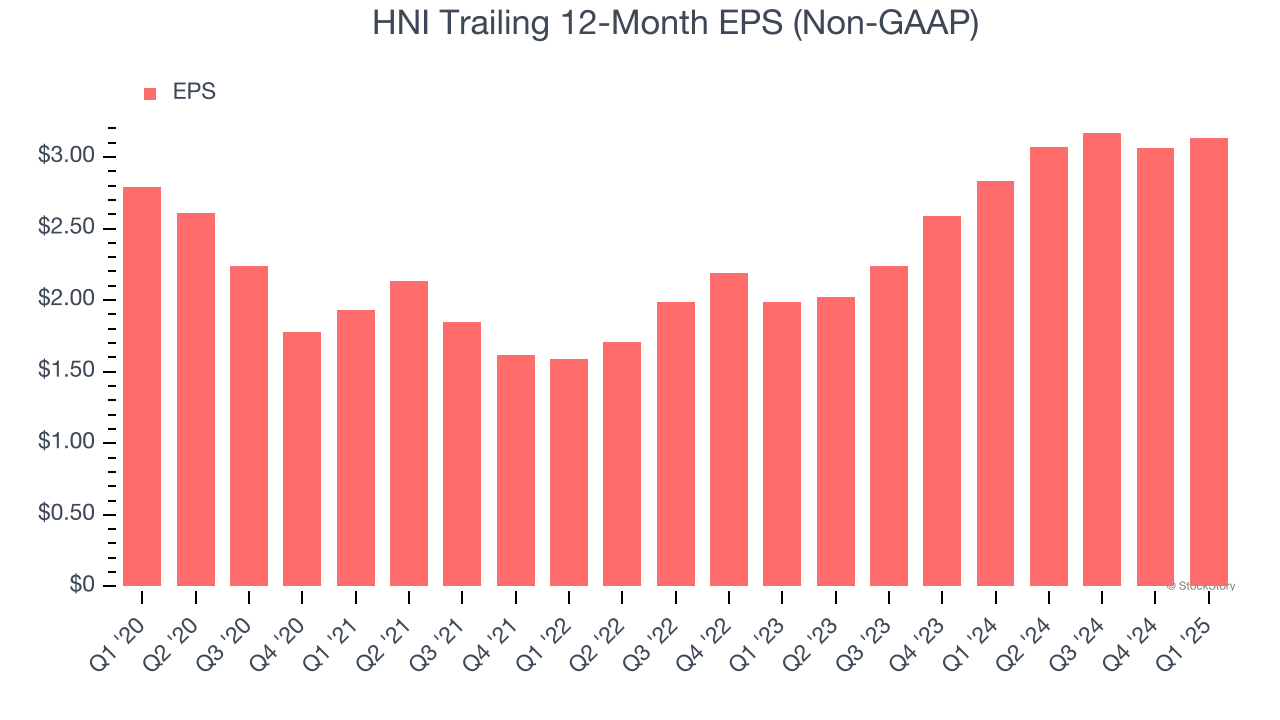
In Q1, HNI reported EPS at $0.44, up from $0.37 in the same quarter last year. This print easily cleared analysts’ estimates, and shareholders should be content with the results. Over the next 12 months, Wall Street expects HNI’s full-year EPS of $3.13 to grow 13.1%.
Key Takeaways from HNI’s Q1 Results
We were impressed by how significantly HNI blew past analysts’ revenue, EPS, and EBITDA expectations this quarter. Zooming out, we think this was a good print with some key areas of upside. The stock traded up 3.8% to $44.99 immediately following the results.
HNI put up rock-solid earnings, but one quarter doesn’t necessarily make the stock a buy. Let’s see if this is a good investment. If you’re making that decision, you should consider the bigger picture of valuation, business qualities, as well as the latest earnings. We cover that in our actionable full research report which you can read here, it’s free.


