


Global entertainment and media company Disney (NYSE: DIS) reported Q1 CY2025 results exceeding the market’s revenue expectations, with sales up 7% year on year to $23.62 billion. Its non-GAAP profit of $1.45 per share was 19.8% above analysts’ consensus estimates.
Is now the time to buy Disney? Find out by accessing our full research report, it’s free.
Disney (DIS) Q1 CY2025 Highlights:
- Revenue: $23.62 billion vs analyst estimates of $23.17 billion (7% year-on-year growth, 2% beat)
- Adjusted EPS: $1.45 vs analyst estimates of $1.21 (19.8% beat)
- Disney+ Subscribers: 126 million vs analyst estimates of 123.35 million (beat, surprising net adds with Street expecting decline)
- 2025 Adjusted EPS Guidance: $5.75 vs analyst estimates of $5.44 (5.7% beat)
- Operating Margin: 18.8%, up from 13.7% in the same quarter last year
- Free Cash Flow Margin: 20.7%, up from 10.9% in the same quarter last year
- Market Capitalization: $166.6 billion
“Our outstanding performance this quarter—with adjusted EPS(1) up 20% from the prior year driven by our Entertainment and Experiences businesses—underscores our continued success building for growth and executing across our strategic priorities,” said Robert A. Iger, Chief Executive Officer, The Walt Disney Company.
Company Overview
Founded by brothers Walt and Roy, Disney (NYSE: DIS) is a multinational entertainment conglomerate, renowned for its theme parks, movies, television networks, and merchandise.
Sales Growth
Reviewing a company’s long-term sales performance reveals insights into its quality. Even a bad business can shine for one or two quarters, but a top-tier one grows for years. Unfortunately, Disney’s 3.7% annualized revenue growth over the last five years was sluggish. This was below our standard for the consumer discretionary sector and is a poor baseline for our analysis.
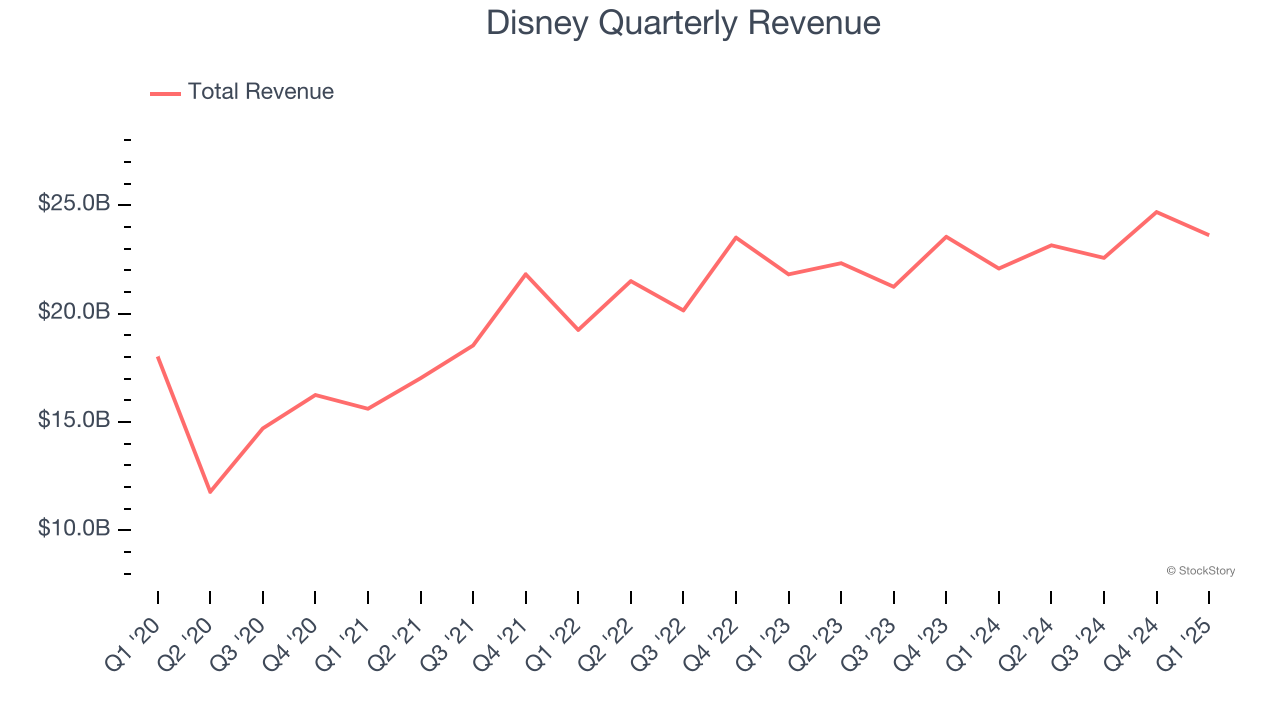
We at StockStory place the most emphasis on long-term growth, but within consumer discretionary, a stretched historical view may miss a company riding a successful new product or trend. Disney’s annualized revenue growth of 4% over the last two years aligns with its five-year trend, suggesting its demand was consistently weak. 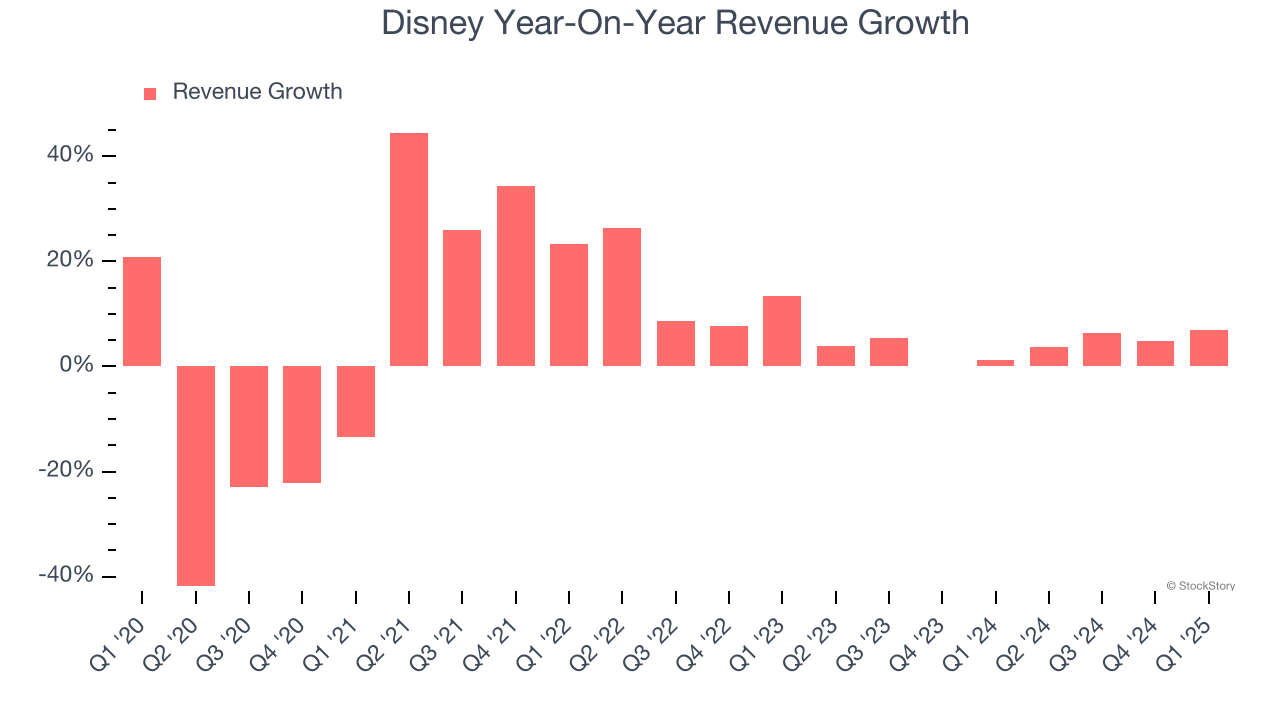
We can dig further into the company’s revenue dynamics by analyzing its three most important segments: Entertainment, Sports, and Experiences, which are 45.2%, 19.2%, and 37.6% of revenue. Over the last two years, Disney’s revenues in all three segments increased. Its Entertainment revenue (movies, Disney+) averaged year-on-year growth of 3.5% while its Sports (ESPN, SEC Network) and Experiences (theme parks) revenues averaged 1.8% and 6.8%.
This quarter, Disney reported year-on-year revenue growth of 7%, and its $23.62 billion of revenue exceeded Wall Street’s estimates by 2%.
Looking ahead, sell-side analysts expect revenue to grow 3.3% over the next 12 months, similar to its two-year rate. This projection doesn't excite us and suggests its newer products and services will not lead to better top-line performance yet.
Software is eating the world and there is virtually no industry left that has been untouched by it. That drives increasing demand for tools helping software developers do their jobs, whether it be monitoring critical cloud infrastructure, integrating audio and video functionality, or ensuring smooth content streaming. Click here to access a free report on our 3 favorite stocks to play this generational megatrend.
Operating Margin
Operating margin is a key measure of profitability. Think of it as net income - the bottom line - excluding the impact of taxes and interest on debt, which are less connected to business fundamentals.
Disney’s operating margin has been trending up over the last 12 months and averaged 14.7% over the last two years. Its solid profitability for a consumer discretionary business shows it’s an efficient company that manages its expenses effectively.
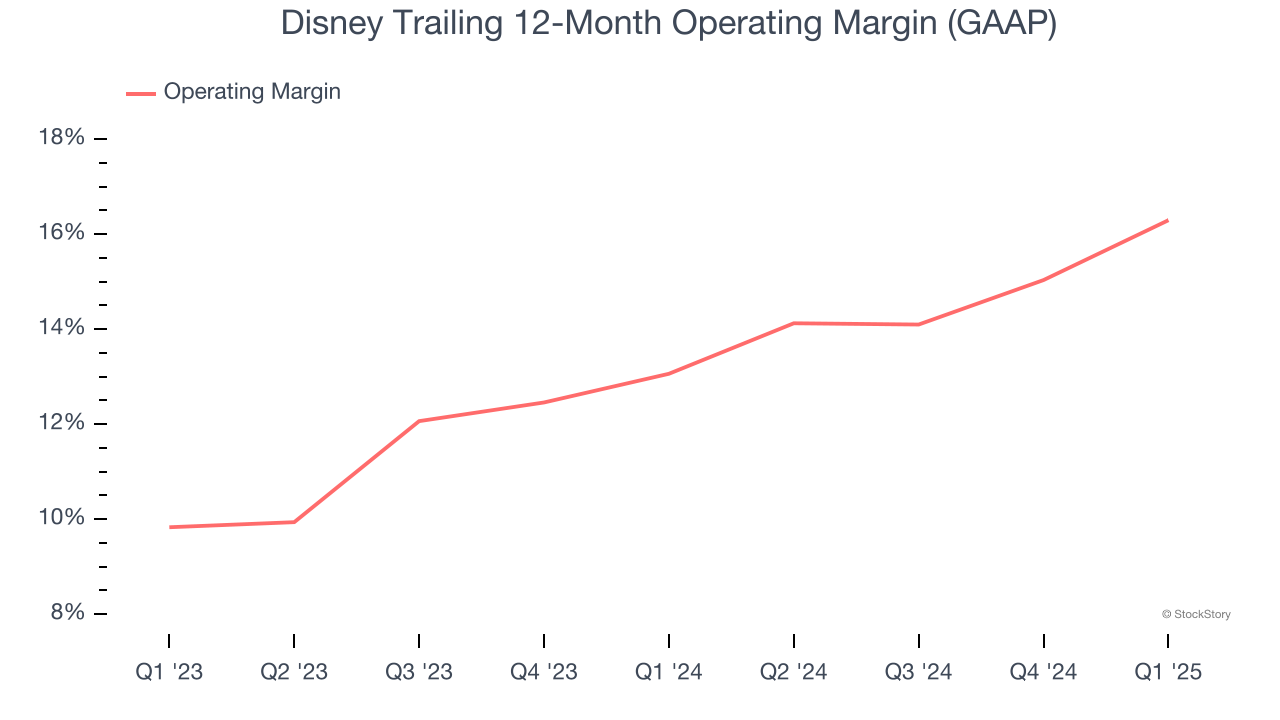
This quarter, Disney generated an operating profit margin of 18.8%, up 5.1 percentage points year on year. This increase was a welcome development and shows it was more efficient.
Earnings Per Share
Revenue trends explain a company’s historical growth, but the long-term change in earnings per share (EPS) points to the profitability of that growth – for example, a company could inflate its sales through excessive spending on advertising and promotions.
Disney’s unimpressive 4.5% annual EPS growth over the last five years aligns with its revenue performance. On the bright side, this tells us its incremental sales were profitable.
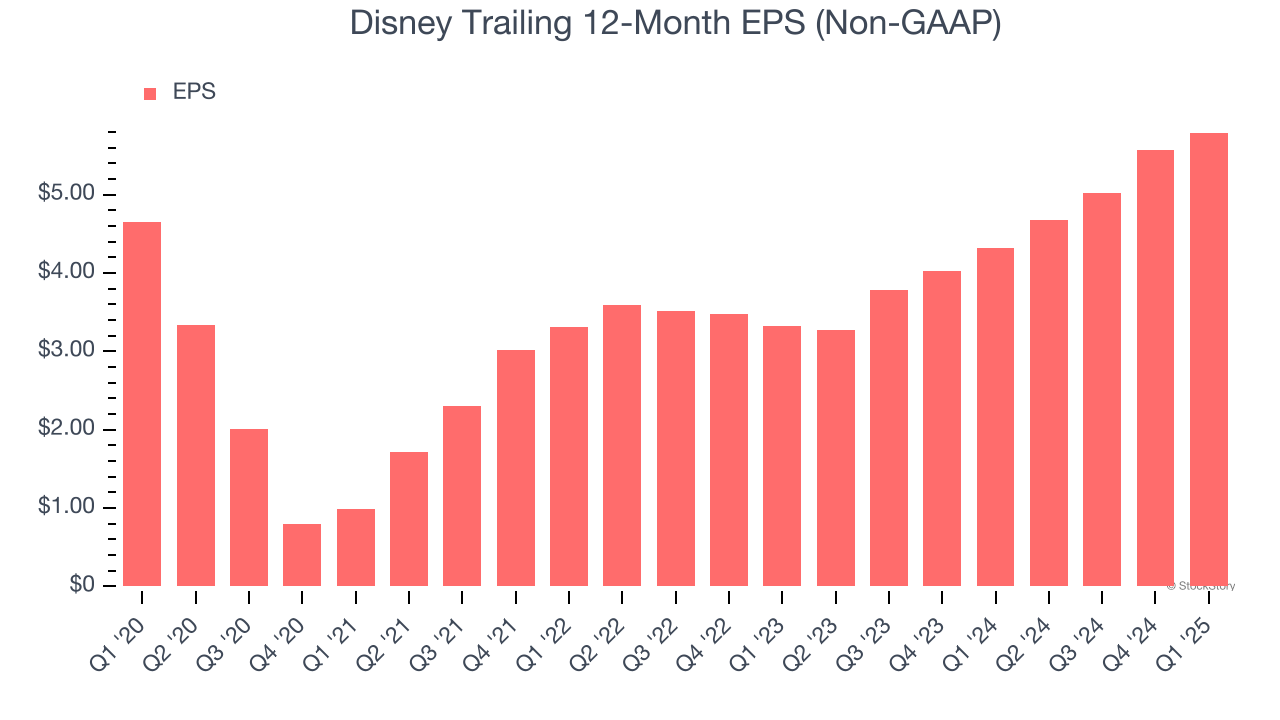
In Q1, Disney reported EPS at $1.45, up from $1.22 in the same quarter last year. This print easily cleared analysts’ estimates, and shareholders should be content with the results. Over the next 12 months, Wall Street expects Disney’s full-year EPS of $5.79 to shrink by 4.6%.
Key Takeaways from Disney’s Q1 Results
We enjoyed seeing Disney beat analysts’ revenue and EPS expectations this quarter. We were also impressed that Disney+ net adds were positive and beat Wall Street's estimates. The icing on the cake was full-year adjusted EPS guidance that handily topped expectations. Zooming out, we think this was a very good print. The stock traded up 5.5% to $97.10 immediately following the results.
Disney had an encouraging quarter, but one earnings result doesn’t necessarily make the stock a buy. Let’s see if this is a good investment. What happened in the latest quarter matters, but not as much as longer-term business quality and valuation, when deciding whether to invest in this stock. We cover that in our actionable full research report which you can read here, it’s free.


