


Server solutions provider Super Micro (NASDAQ: SMCI) fell short of the market’s revenue expectations in Q1 CY2025, but sales rose 19.5% year on year to $4.6 billion. Next quarter’s revenue guidance of $6 billion underwhelmed, coming in 14.1% below analysts’ estimates. Its non-GAAP profit of $0.31 per share was 3.8% above analysts’ consensus estimates.
Is now the time to buy Super Micro? Find out by accessing our full research report, it’s free.
Super Micro (SMCI) Q1 CY2025 Highlights:
- Revenue: $4.6 billion vs analyst estimates of $4.73 billion (19.5% year-on-year growth, 2.7% miss)
- Adjusted EPS: $0.31 vs analyst estimates of $0.30 (3.8% beat)
- Adjusted EBITDA: $258.2 million vs analyst estimates of $384.7 million (5.6% margin, 32.9% miss)
- Revenue Guidance for Q2 CY2025 is $6 billion at the midpoint, below analyst estimates of $6.98 billion
- Adjusted EPS guidance for Q2 CY2025 is $0.45 at the midpoint, below analyst estimates of $0.64
- Operating Margin: 3.2%, down from 9.8% in the same quarter last year
- Market Capitalization: $19.2 billion
Company Overview
Founded in Silicon Valley in 1993 and known for its modular "building block" approach to server design, Super Micro Computer (NASDAQ: SMCI) designs and manufactures high-performance, energy-efficient server and storage systems for data centers, cloud computing, AI, and edge computing applications.
Sales Growth
Reviewing a company’s long-term sales performance reveals insights into its quality. Any business can put up a good quarter or two, but many enduring ones grow for years.
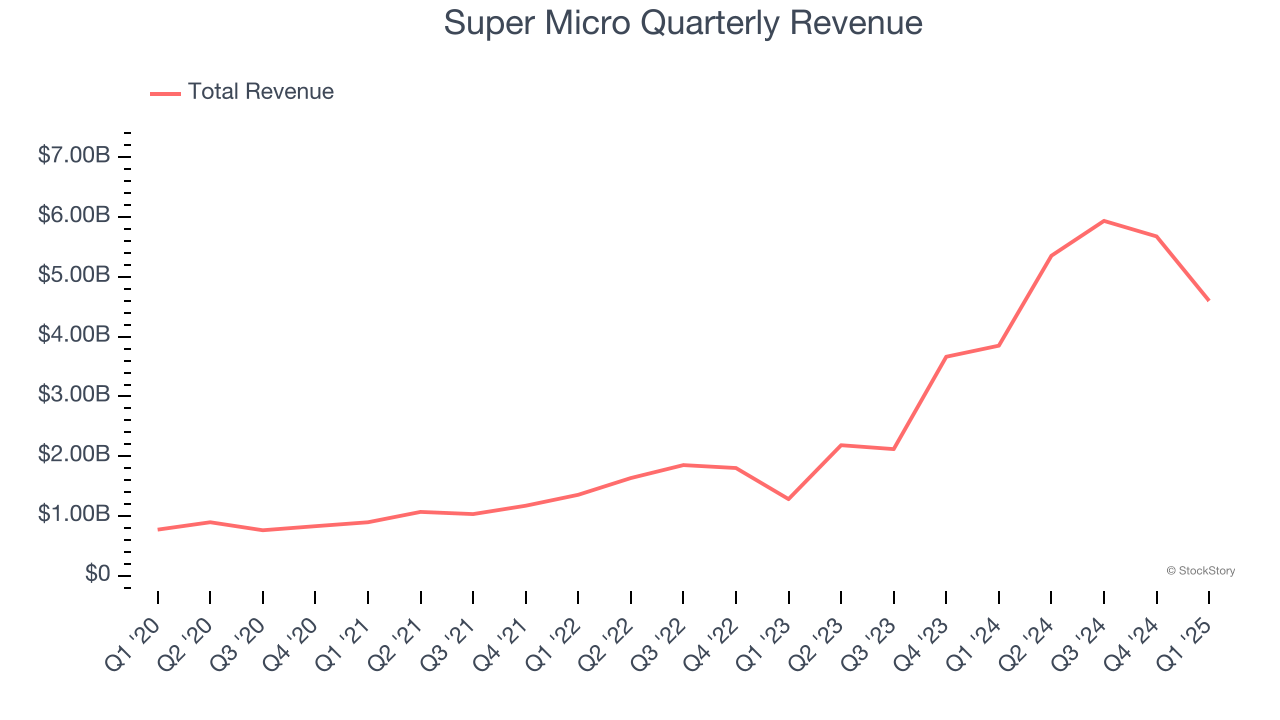
With $21.57 billion in revenue over the past 12 months, Super Micro is a behemoth in the business services sector and benefits from economies of scale, giving it an edge in distribution. This also enables it to gain more leverage on its fixed costs than smaller competitors and the flexibility to offer lower prices.
As you can see below, Super Micro’s sales grew at an incredible 45.6% compounded annual growth rate over the last five years. This is a great starting point for our analysis because it shows Super Micro’s demand was higher than many business services companies.
We at StockStory place the most emphasis on long-term growth, but within business services, a half-decade historical view may miss recent innovations or disruptive industry trends. Super Micro’s annualized revenue growth of 81.1% over the last two years is above its five-year trend, suggesting its demand was strong and recently accelerated. 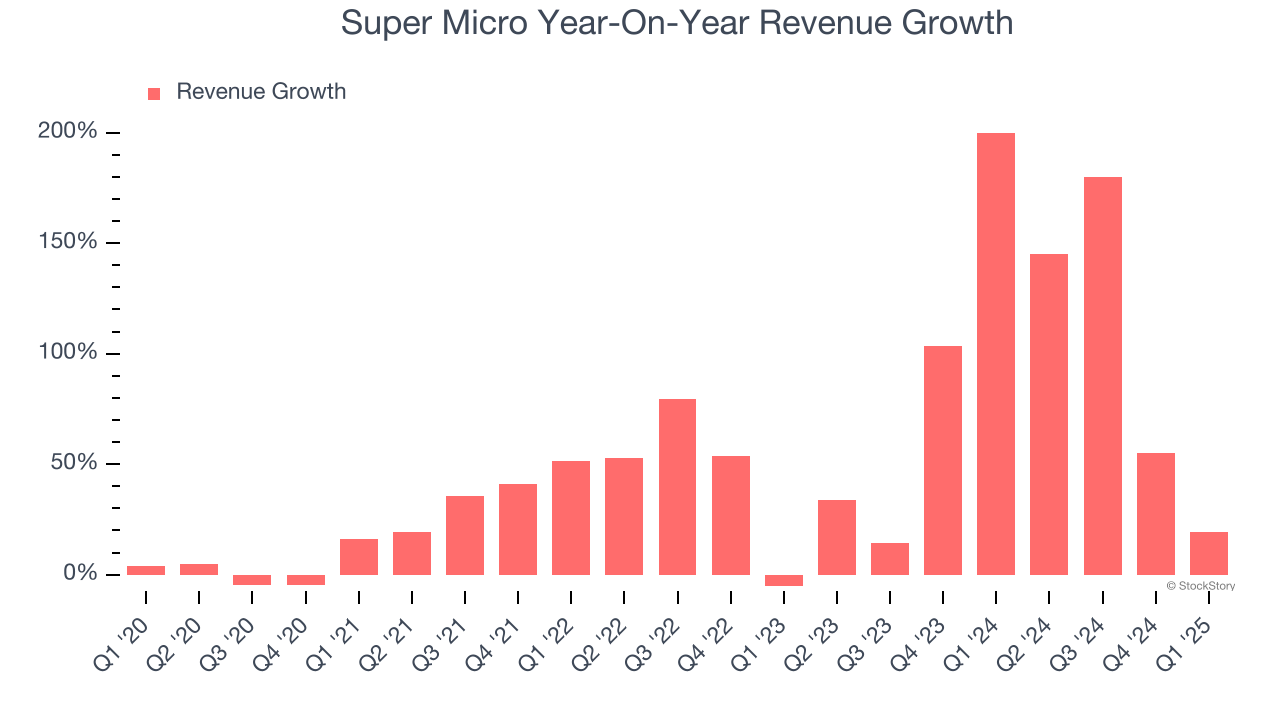
This quarter, Super Micro’s revenue grew by 19.5% year on year to $4.6 billion but fell short of Wall Street’s estimates. Company management is currently guiding for a 12.1% year-on-year increase in sales next quarter.
Looking further ahead, sell-side analysts expect revenue to grow 42.1% over the next 12 months, a deceleration versus the last two years. Still, this projection is eye-popping given its scale and implies the market is forecasting success for its products and services.
Software is eating the world and there is virtually no industry left that has been untouched by it. That drives increasing demand for tools helping software developers do their jobs, whether it be monitoring critical cloud infrastructure, integrating audio and video functionality, or ensuring smooth content streaming. Click here to access a free report on our 3 favorite stocks to play this generational megatrend.
Operating Margin
Operating margin is an important measure of profitability as it shows the portion of revenue left after accounting for all core expenses – everything from the cost of goods sold to advertising and wages. It’s also useful for comparing profitability across companies with different levels of debt and tax rates because it excludes interest and taxes.
Super Micro was profitable over the last five years but held back by its large cost base. Its average operating margin of 7.2% was weak for a business services business.
On the plus side, Super Micro’s operating margin rose by 3.3 percentage points over the last five years, as its sales growth gave it operating leverage.
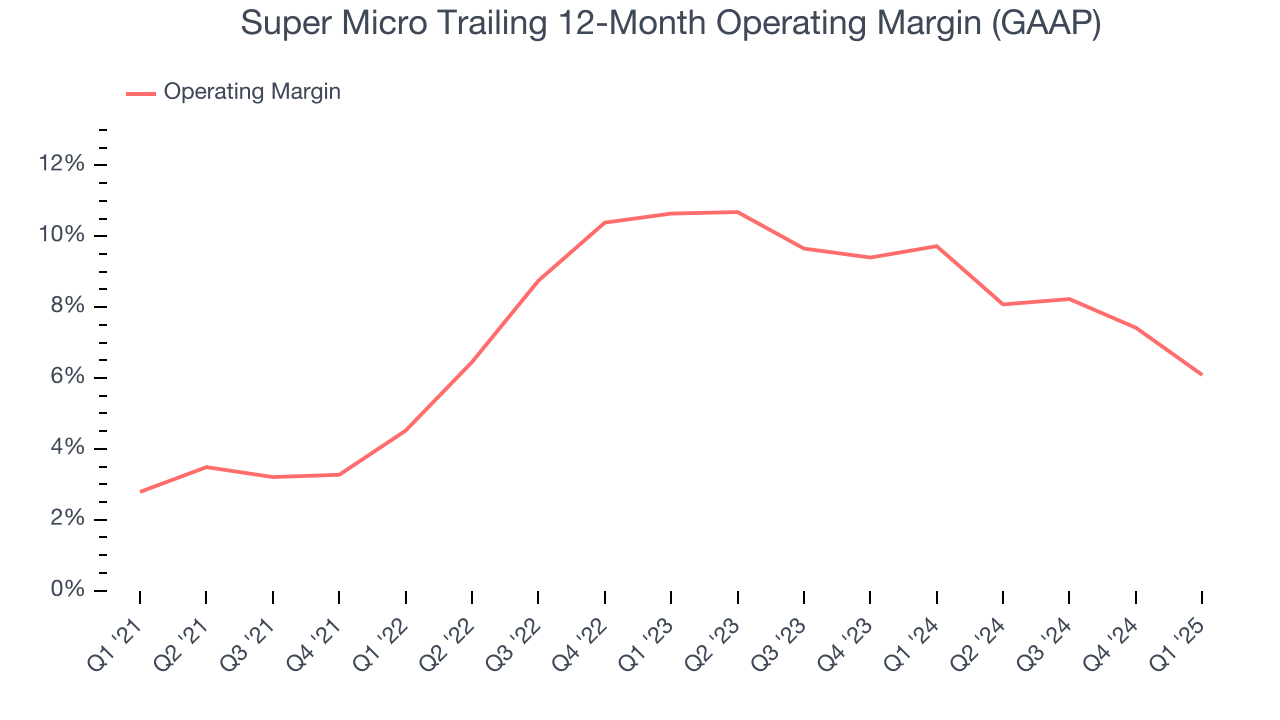
This quarter, Super Micro generated an operating profit margin of 3.2%, down 6.6 percentage points year on year. This contraction shows it was less efficient because its expenses grew faster than its revenue.
Earnings Per Share
We track the long-term change in earnings per share (EPS) for the same reason as long-term revenue growth. Compared to revenue, however, EPS highlights whether a company’s growth is profitable.
Super Micro’s EPS grew at an astounding 23.3% compounded annual growth rate over the last five years. Despite its operating margin expansion during that time, this performance was lower than its 45.6% annualized revenue growth, telling us that non-fundamental factors such as interest and taxes affected its ultimate earnings.
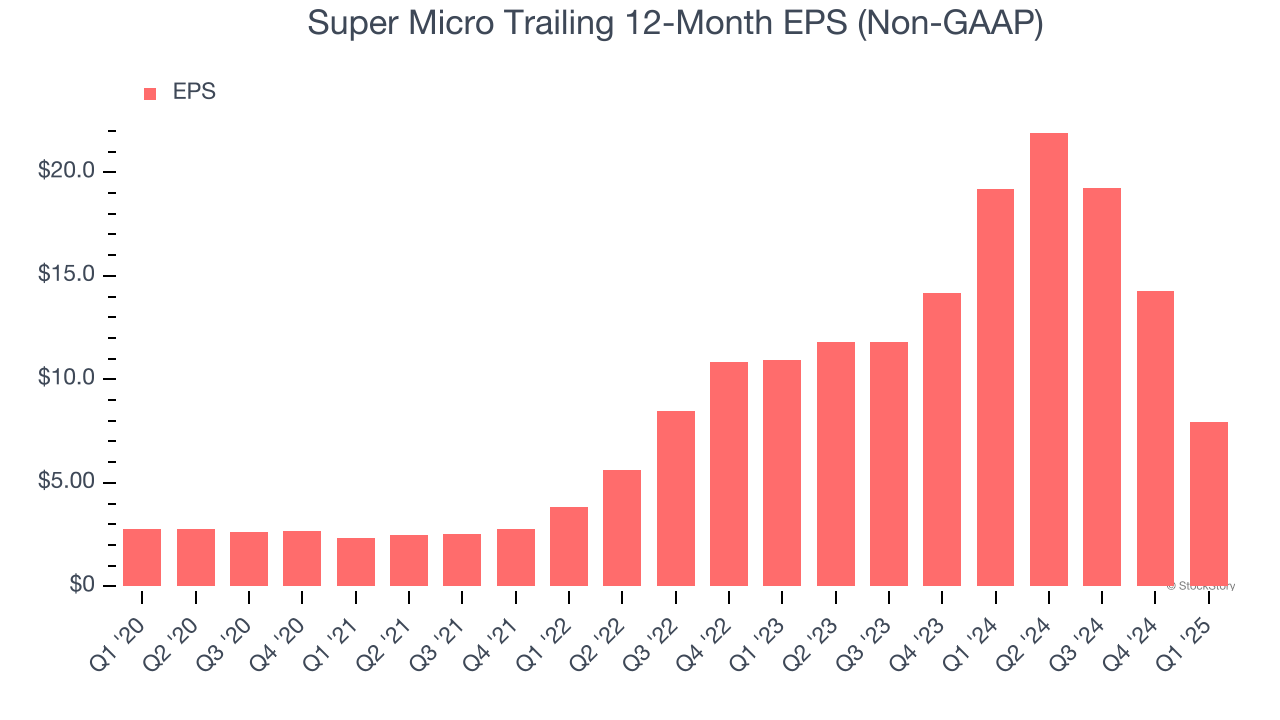
We can take a deeper look into Super Micro’s earnings quality to better understand the drivers of its performance. A five-year view shows Super Micro has diluted its shareholders, growing its share count by 15.8%. This dilution overshadowed its increased operating efficiency and has led to lower per share earnings. Taxes and interest expenses can also affect EPS but don’t tell us as much about a company’s fundamentals. 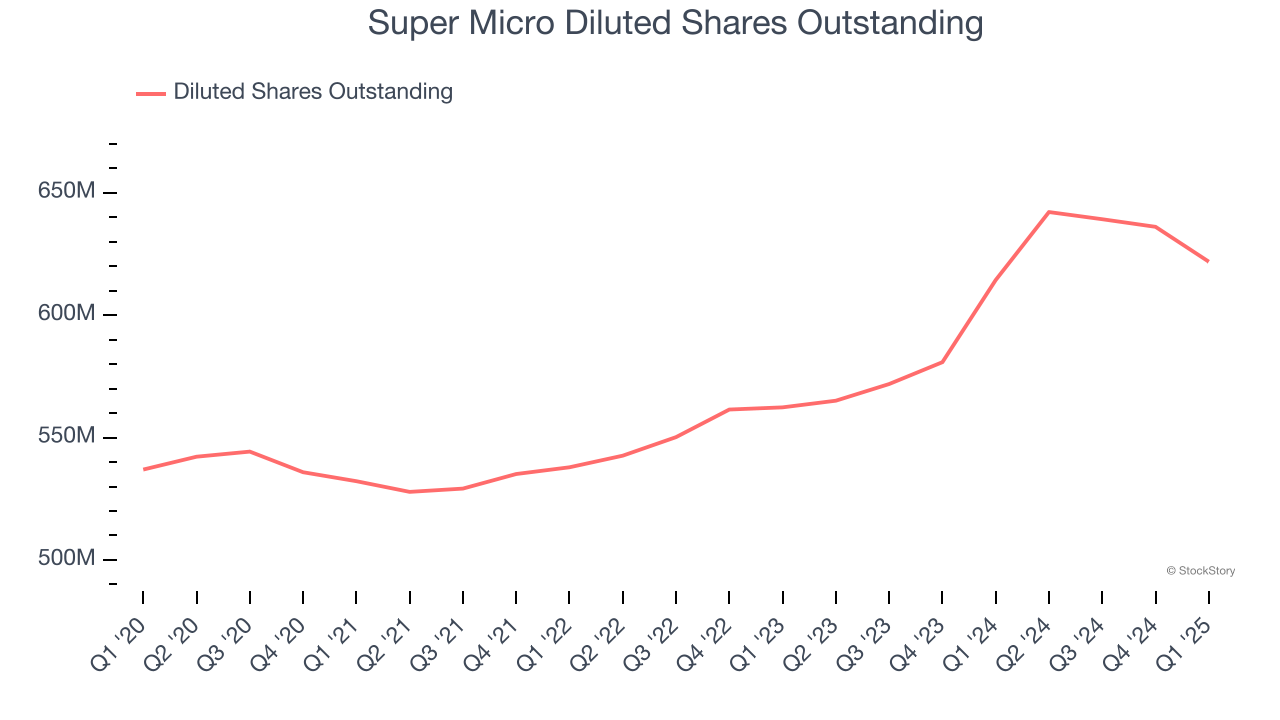
In Q1, Super Micro reported EPS at $0.31, down from $6.65 in the same quarter last year. Despite falling year on year, this print beat analysts’ estimates by 3.8%. Over the next 12 months, Wall Street expects Super Micro’s full-year EPS of $7.92 to shrink by 60.3%. This is unusual as its revenue and operating margin are anticipated to increase, signaling the fall likely stems from "below-the-line" items such as taxes.
Key Takeaways from Super Micro’s Q1 Results
It was great to see Super Micro’s full-year revenue guidance top analysts’ expectations. We were also happy its EPS outperformed Wall Street’s estimates. On the other hand, its revenue guidance for next quarter missed significantly and its revenue fell short of Wall Street’s estimates. Overall, this was a softer quarter. The stock traded down 3.7% to $31.67 immediately following the results.
Super Micro underperformed this quarter, but does that create an opportunity to invest right now? We think that the latest quarter is only one piece of the longer-term business quality puzzle. Quality, when combined with valuation, can help determine if the stock is a buy. We cover that in our actionable full research report which you can read here, it’s free.


