


Pool equipment and automation systems manufacturer Hayward Holdings (NYSE: HAYW) reported Q1 CY2025 results beating Wall Street’s revenue expectations, with sales up 7.7% year on year to $228.8 million. The company expects the full year’s revenue to be around $1.08 billion, close to analysts’ estimates. Its non-GAAP profit of $0.10 per share was 17.4% above analysts’ consensus estimates.
Is now the time to buy Hayward? Find out by accessing our full research report, it’s free.
Hayward (HAYW) Q1 CY2025 Highlights:
- Revenue: $228.8 million vs analyst estimates of $213.7 million (7.7% year-on-year growth, 7.1% beat)
- Adjusted EPS: $0.10 vs analyst estimates of $0.09 (17.4% beat)
- Adjusted EBITDA: $49.1 million vs analyst estimates of $42.7 million (21.5% margin, 15% beat)
- The company reconfirmed its revenue guidance for the full year of $1.08 billion at the midpoint
- EBITDA guidance for the full year is $285 million at the midpoint, in line with analyst expectations
- Operating Margin: 14.6%, in line with the same quarter last year
- Free Cash Flow was -$11.96 million compared to -$83.14 million in the same quarter last year
- Market Capitalization: $2.88 billion
CHARLOTTE, N.C.--(BUSINESS WIRE)--Hayward Holdings, Inc. (NYSE: HAYW) (“Hayward” or the “Company”), a global designer, manufacturer and marketer of a broad portfolio of pool and outdoor living technology, today announced financial results for the first quarter ended March 29, 2025 of its fiscal year 2025.
Company Overview
Credited with introducing the first variable-speed pool pump, Hayward (NYSE: HAYW) makes residential and commercial pool equipment and accessories.
Sales Growth
Reviewing a company’s long-term sales performance reveals insights into its quality. Any business can put up a good quarter or two, but the best consistently grow over the long haul. Regrettably, Hayward’s sales grew at a mediocre 7.1% compounded annual growth rate over the last five years. This fell short of our benchmark for the industrials sector and is a poor baseline for our analysis.
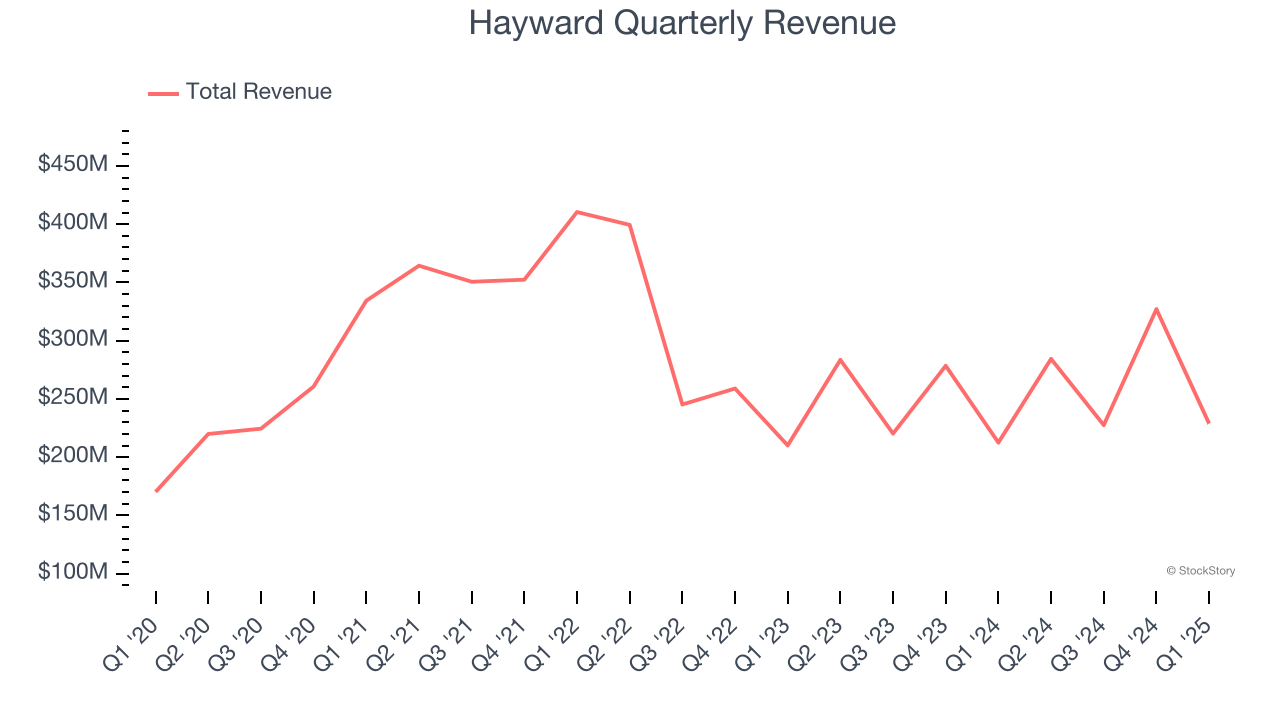
Long-term growth is the most important, but within industrials, a half-decade historical view may miss new industry trends or demand cycles. Hayward’s performance shows it grew in the past but relinquished its gains over the last two years, as its revenue fell by 2.1% annually. 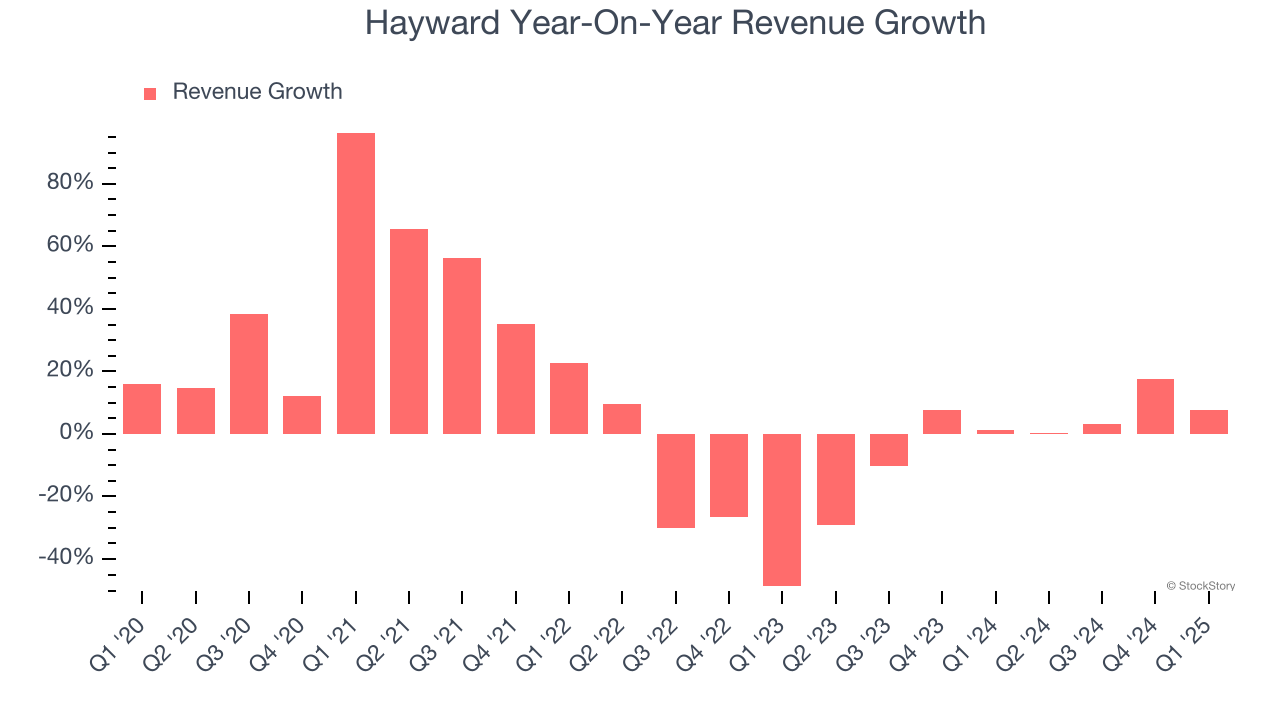
This quarter, Hayward reported year-on-year revenue growth of 7.7%, and its $228.8 million of revenue exceeded Wall Street’s estimates by 7.1%.
Looking ahead, sell-side analysts expect revenue to grow 2.5% over the next 12 months. Although this projection indicates its newer products and services will fuel better top-line performance, it is still below average for the sector.
Software is eating the world and there is virtually no industry left that has been untouched by it. That drives increasing demand for tools helping software developers do their jobs, whether it be monitoring critical cloud infrastructure, integrating audio and video functionality, or ensuring smooth content streaming. Click here to access a free report on our 3 favorite stocks to play this generational megatrend.
Operating Margin
Operating margin is a key measure of profitability. Think of it as net income - the bottom line - excluding the impact of taxes and interest on debt, which are less connected to business fundamentals.
Hayward has been a well-oiled machine over the last five years. It demonstrated elite profitability for an industrials business, boasting an average operating margin of 19.9%. This result isn’t surprising as its high gross margin gives it a favorable starting point.
Looking at the trend in its profitability, Hayward’s operating margin rose by 1.4 percentage points over the last five years, as its sales growth gave it operating leverage.
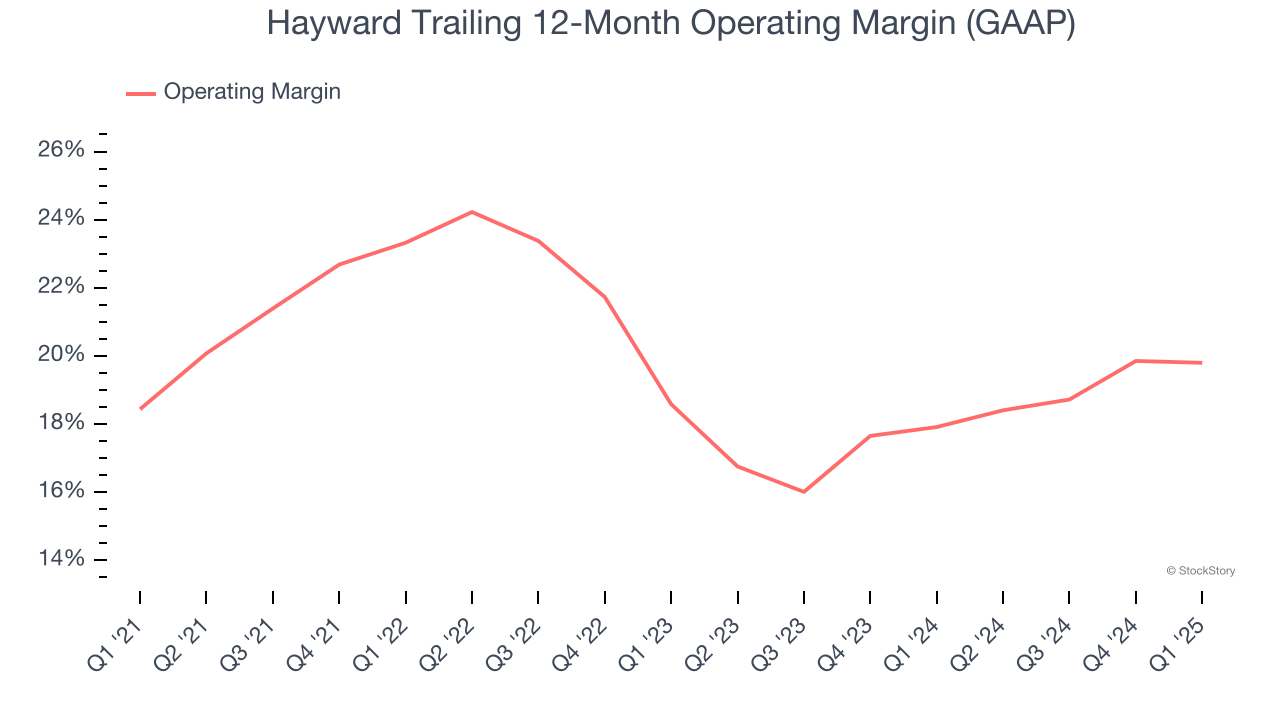
In Q1, Hayward generated an operating profit margin of 14.6%, in line with the same quarter last year. This indicates the company’s cost structure has recently been stable.
Earnings Per Share
We track the long-term change in earnings per share (EPS) for the same reason as long-term revenue growth. Compared to revenue, however, EPS highlights whether a company’s growth is profitable.
Sadly for Hayward, its EPS declined by 58.1% annually over the last five years while its revenue grew by 7.1%. However, its operating margin actually expanded during this time, telling us that non-fundamental factors such as interest expenses and taxes affected its ultimate earnings.
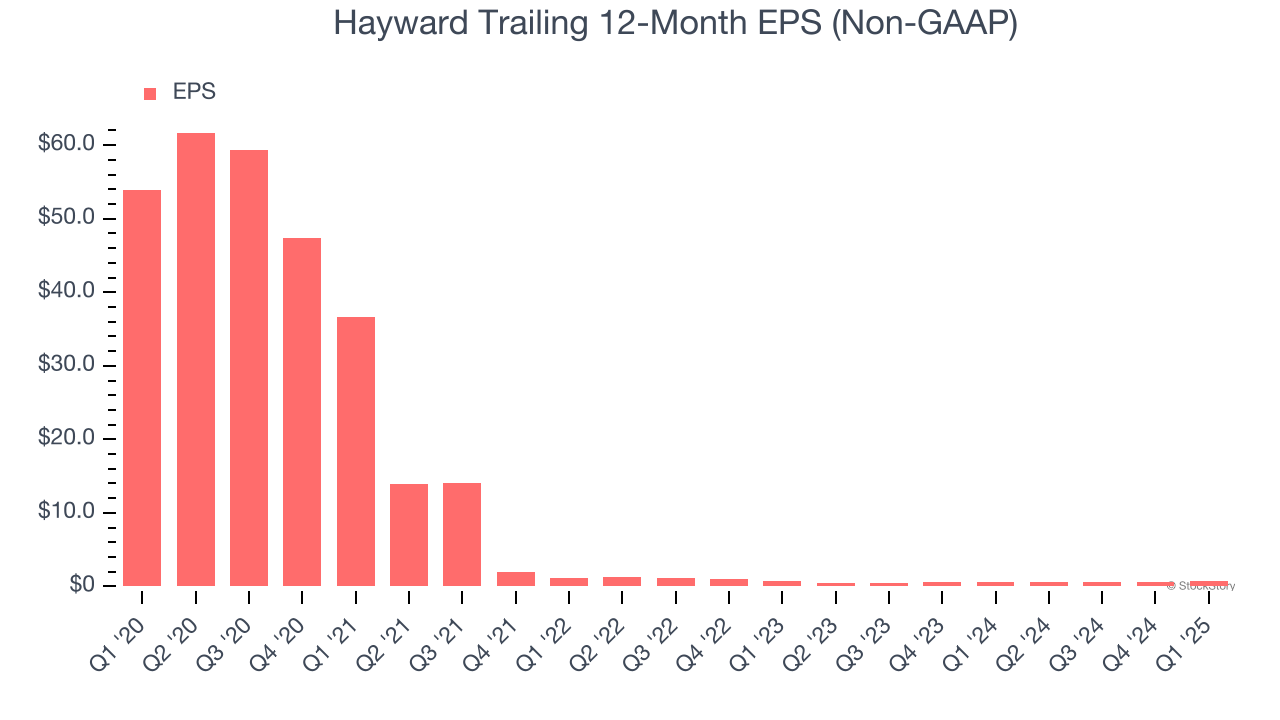
We can take a deeper look into Hayward’s earnings to better understand the drivers of its performance. Hayward recently raised equity capital, and in the process, grew its share count by 10,507% over the last five years. This has resulted in muted earnings per share growth but doesn’t tell us as much about its future. We prefer to look at operating and free cash flow margins in these situations. 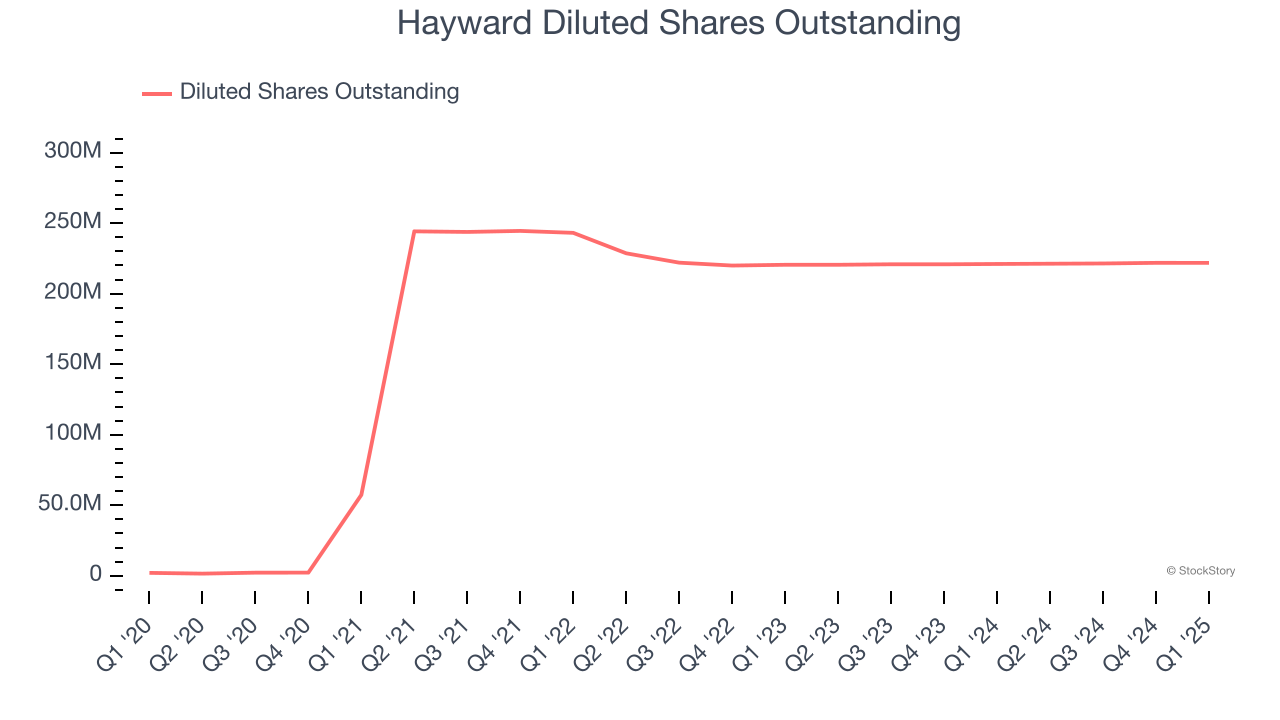
Like with revenue, we analyze EPS over a more recent period because it can provide insight into an emerging theme or development for the business.
For Hayward, EPS didn’t budge over the last two years, but at least that was better than its five-year trend. We hope its earnings can grow in the coming years.
In Q1, Hayward reported EPS at $0.10, up from $0.08 in the same quarter last year. This print easily cleared analysts’ estimates, and shareholders should be content with the results. Over the next 12 months, Wall Street expects Hayward’s full-year EPS of $0.69 to grow 9.6%.
Key Takeaways from Hayward’s Q1 Results
We were impressed by how significantly Hayward blew past analysts’ EBITDA expectations this quarter. We were also excited its revenue outperformed Wall Street’s estimates by a wide margin. Overall, we think this was a decent quarter with some key metrics above expectations. The stock traded up 1.2% to $13.50 immediately following the results.
Hayward had an encouraging quarter, but one earnings result doesn’t necessarily make the stock a buy. Let’s see if this is a good investment. We think that the latest quarter is only one piece of the longer-term business quality puzzle. Quality, when combined with valuation, can help determine if the stock is a buy. We cover that in our actionable full research report which you can read here, it’s free.


