Data center products and services company Vertiv (NYSE: VRT) announced better-than-expected revenue in Q1 CY2025, with sales up 24.2% year on year to $2.04 billion. On top of that, next quarter’s revenue guidance ($2.35 billion at the midpoint) was surprisingly good and 3.7% above what analysts were expecting. Its non-GAAP profit of $0.64 per share was 3.9% above analysts’ consensus estimates.
Is now the time to buy Vertiv? Find out by accessing our full research report, it’s free.
Vertiv (VRT) Q1 CY2025 Highlights:
- Revenue: $2.04 billion vs analyst estimates of $1.93 billion (24.2% year-on-year growth, 5.2% beat)
- Adjusted EPS: $0.64 vs analyst estimates of $0.62 (3.9% beat)
- The company lifted its revenue guidance for the full year to $9.45 billion at the midpoint from $9.2 billion, a 2.7% increase
- Management reiterated its full-year Adjusted EPS guidance of $3.55 at the midpoint
- Operating Margin: 14.3%, up from 12.4% in the same quarter last year
- Free Cash Flow Margin: 13%, up from 6.2% in the same quarter last year
- Organic Revenue rose 25.3% year on year (8.1% in the same quarter last year)
- Market Capitalization: $27.35 billion
"Vertiv's strong first quarter results demonstrate our continued momentum and reinforce our position for long-term sustainable growth," said Giordano Albertazzi, Vertiv's Chief Executive Officer.
Company Overview
Formerly part of Emerson Electric, Vertiv (NYSE: VRT) manufactures and services infrastructure technology products for data centers and communication networks.
Electrical Systems
Like many equipment and component manufacturers, electrical systems companies are buoyed by secular trends such as connectivity and industrial automation. More specific pockets of strong demand include Internet of Things (IoT) connectivity and the 5G telecom upgrade cycle, which can benefit companies whose cables and conduits fit those needs. But like the broader industrials sector, these companies are also at the whim of economic cycles. Interest rates, for example, can greatly impact projects that drive demand for these products.
Sales Growth
Reviewing a company’s long-term sales performance reveals insights into its quality. Even a bad business can shine for one or two quarters, but a top-tier one grows for years. Luckily, Vertiv’s sales grew at an exceptional 14.5% compounded annual growth rate over the last five years. Its growth surpassed the average industrials company and shows its offerings resonate with customers, a great starting point for our analysis.
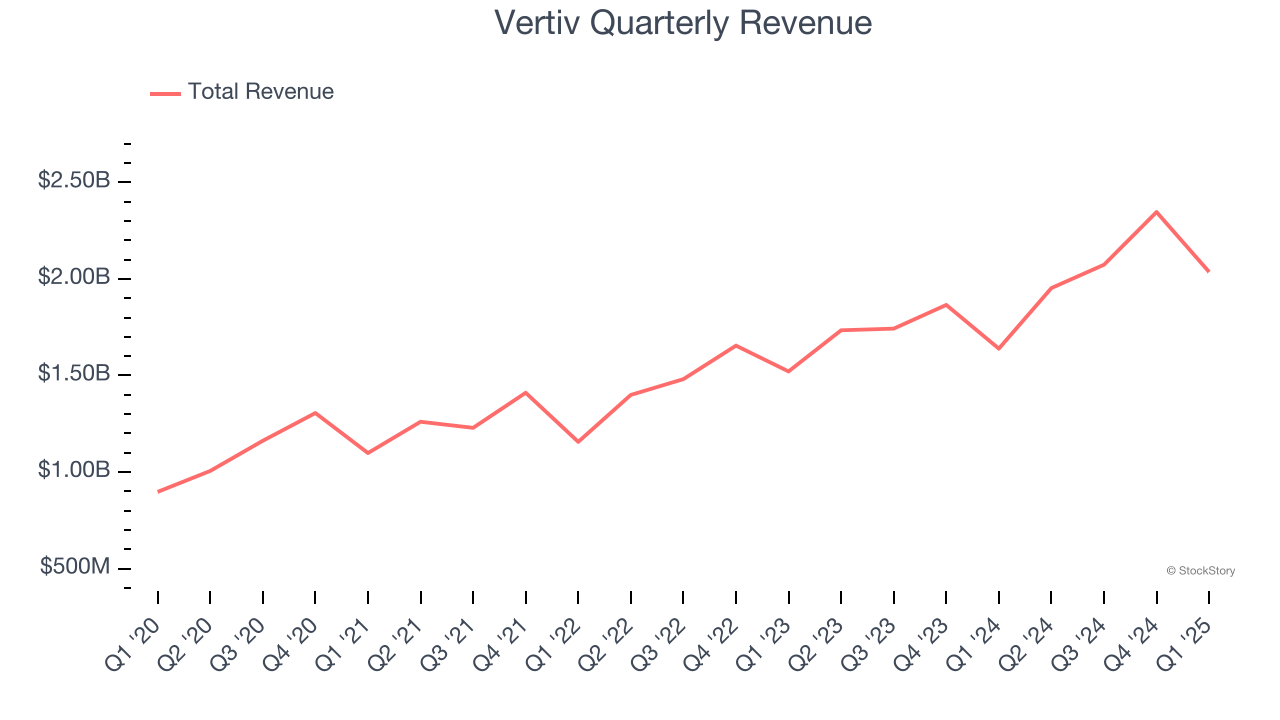
Long-term growth is the most important, but within industrials, a half-decade historical view may miss new industry trends or demand cycles. Vertiv’s annualized revenue growth of 17.8% over the last two years is above its five-year trend, suggesting its demand was strong and recently accelerated. 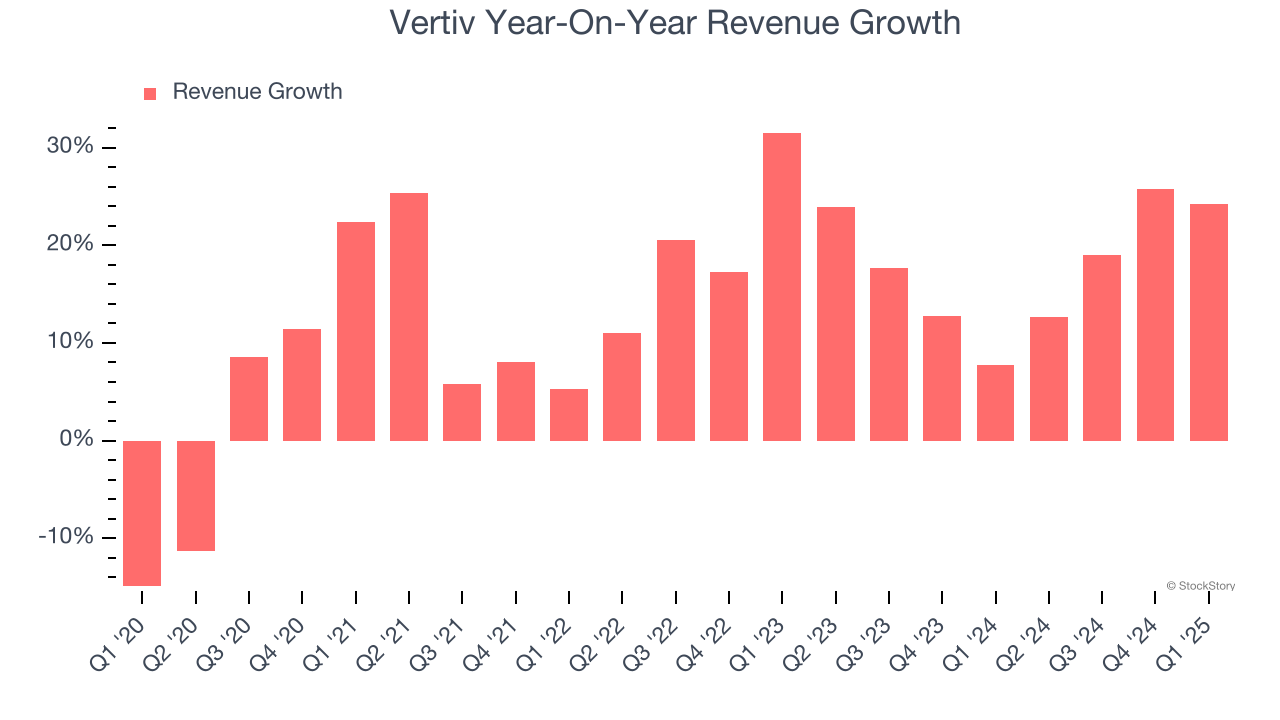
We can dig further into the company’s sales dynamics by analyzing its organic revenue, which strips out one-time events like acquisitions and currency fluctuations that don’t accurately reflect its fundamentals. Over the last two years, Vertiv’s organic revenue averaged 18.5% year-on-year growth. Because this number aligns with its normal revenue growth, we can see the company’s core operations (not acquisitions and divestitures) drove most of its results. 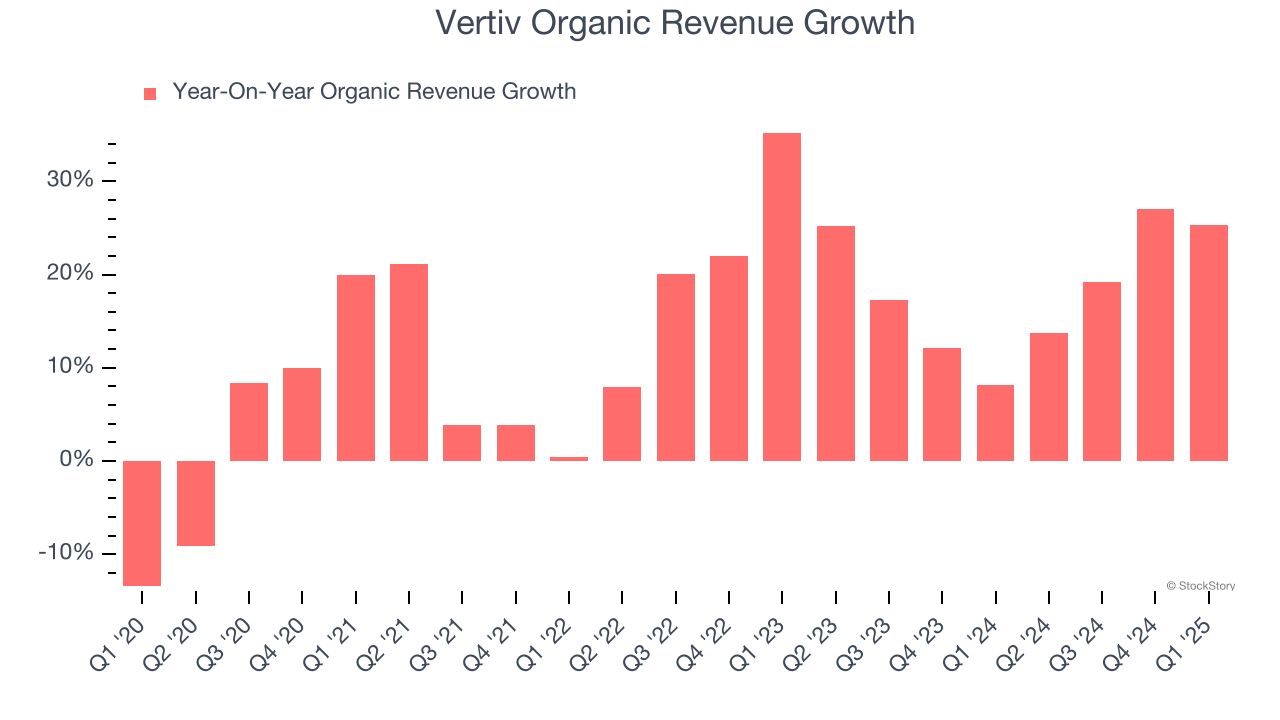
This quarter, Vertiv reported robust year-on-year revenue growth of 24.2%, and its $2.04 billion of revenue topped Wall Street estimates by 5.2%. Company management is currently guiding for a 20.3% year-on-year increase in sales next quarter.
Looking further ahead, sell-side analysts expect revenue to grow 12.9% over the next 12 months, a deceleration versus the last two years. Despite the slowdown, this projection is admirable and implies the market is forecasting success for its products and services.
Unless you’ve been living under a rock, it should be obvious by now that generative AI is going to have a huge impact on how large corporations do business. While Nvidia and AMD are trading close to all-time highs, we prefer a lesser-known (but still profitable) stock benefiting from the rise of AI. Click here to access our free report one of our favorites growth stories.
Operating Margin
Operating margin is a key measure of profitability. Think of it as net income - the bottom line - excluding the impact of taxes and interest on debt, which are less connected to business fundamentals.
Vertiv has managed its cost base well over the last five years. It demonstrated solid profitability for an industrials business, producing an average operating margin of 10.4%. This result isn’t too surprising as its gross margin gives it a favorable starting point.
Looking at the trend in its profitability, Vertiv’s operating margin rose by 10.6 percentage points over the last five years, as its sales growth gave it immense operating leverage.
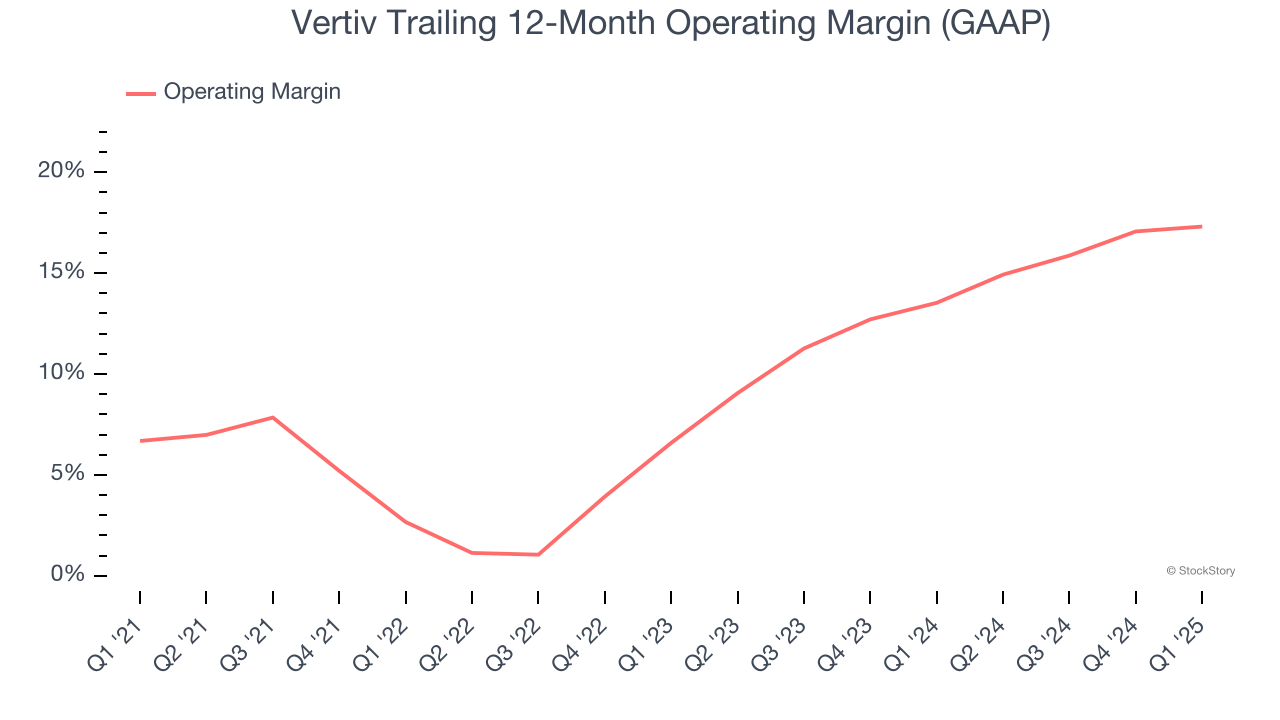
In Q1, Vertiv generated an operating profit margin of 14.3%, up 1.9 percentage points year on year. The increase was encouraging, and because its operating margin rose more than its gross margin, we can infer it was more efficient with expenses such as marketing, R&D, and administrative overhead.
Earnings Per Share
Revenue trends explain a company’s historical growth, but the long-term change in earnings per share (EPS) points to the profitability of that growth – for example, a company could inflate its sales through excessive spending on advertising and promotions.
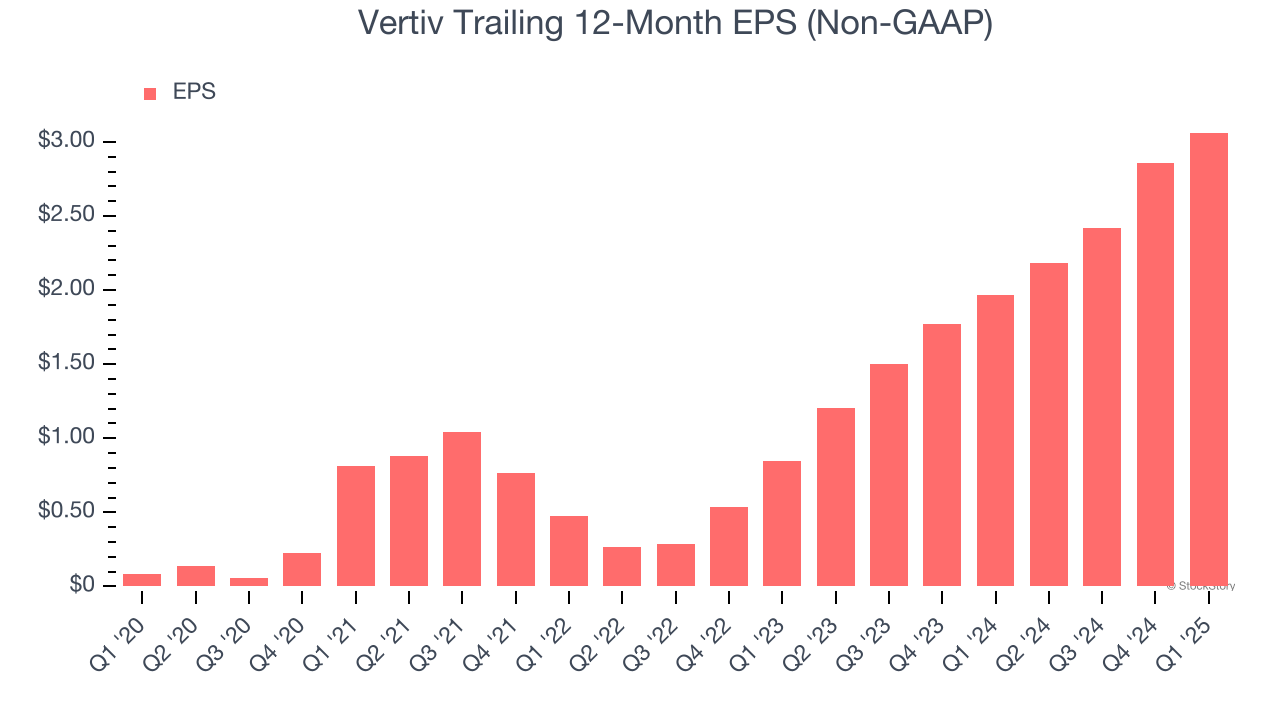
Vertiv’s EPS grew at an astounding 104% compounded annual growth rate over the last five years, higher than its 14.5% annualized revenue growth. This tells us the company became more profitable on a per-share basis as it expanded.
We can take a deeper look into Vertiv’s earnings quality to better understand the drivers of its performance. As we mentioned earlier, Vertiv’s operating margin expanded by 10.6 percentage points over the last five years. This was the most relevant factor (aside from the revenue impact) behind its higher earnings; taxes and interest expenses can also affect EPS but don’t tell us as much about a company’s fundamentals.
Like with revenue, we analyze EPS over a more recent period because it can provide insight into an emerging theme or development for the business.
For Vertiv, its two-year annual EPS growth of 90% was lower than its five-year trend. We still think its growth was good and hope it can accelerate in the future.
In Q1, Vertiv reported EPS at $0.64, up from $0.43 in the same quarter last year. This print beat analysts’ estimates by 3.9%. Over the next 12 months, Wall Street expects Vertiv’s full-year EPS of $3.06 to grow 21.7%.
Key Takeaways from Vertiv’s Q1 Results
We were impressed by how significantly Vertiv blew past analysts’ organic revenue expectations this quarter. We were also excited its revenue outperformed Wall Street’s estimates by a wide margin. Looking ahead, the company raised its full-year revenue guidance and reiterated full-year EPS guidance, which is a relief in this uncertain environment. Zooming out, we think this quarter featured some important positives. The stock traded up 18.5% to $84.99 immediately after reporting.
Sure, Vertiv had a solid quarter, but if we look at the bigger picture, is this stock a buy? When making that decision, it’s important to consider its valuation, business qualities, as well as what has happened in the latest quarter. We cover that in our actionable full research report which you can read here, it’s free.